Introduction and Motivation
Hello I decided to make this complete reference because of a problem I faced at work: a painfully slow query that took 25 seconds to run. Through extensive research and learning, I managed to optimize it to just 1 second. But my journey didn’t stop there; I continued exploring database performance tuning, guided by the book “MySQL 8 Query Performance Tuning.”1 This blog serves as a summary of some chapters and sections from the book. If you find it intriguing, I encourage you to explore the full version, which delves into many more details and insights.
Approaches to MySQL Performance and Query Optimization
MySQL Performance Tuning
Consider the Whole Stack
When discussing MySQL performance, it’s crucial not just to focus on the database layer but to understand the whole technology stack involved. The performance of your application doesn’t solely depend on the query execution time. Network latency, disk I/O, and application-layer bottlenecks can all influence overall performance. Utilize tools like vmstat, iostat, or cloud-specific monitoring services to get a holistic view.
Monitoring
Monitoring is not a one-off task but an ongoing process. Tools like MySQL Enterprise Monitor, Percona Monitoring and Management (PMM), or Zabbix can offer real-time insights. Remember to monitor the Query Performance Statistics and pay attention to variables like Slow_queries, Com_select, Handler_read_first, and so on.
The Lifecycle of a Query
Understanding the lifecycle of a query, from parsing to execution and caching, can offer profound insights into performance optimization. Familiarize yourself with the EXPLAIN statement to visualize query execution plans and get into the habit of analyzing slow queries through the slow query log.
Query Tuning Methodology
Verify the Problem
Before diving into optimization, make sure there’s a problem to solve. Analyze the performance metrics, check query execution times, and compare them to your performance benchmarks. Use the EXPLAIN statement to identify if the query is indeed the bottleneck.
Determine the Cause
Once you have identified a problem, find its root cause. Is it related to inefficient indexes? Or perhaps the join operations are costly? Utilize tools like SHOW PROFILE for detailed query execution statistics.
Determine the Solution
Based on the root cause, formulate a solution. This could involve creating or modifying indexes, rewriting queries to be more efficient, or even scaling your MySQL setup vertically or horizontally.
Implement the Solution
Once the solution has been determined, implement it cautiously. Always backup your database and test the changes in a staging environment first. Measure the impact of your changes by comparing the new performance metrics to the old ones.
Work Proactively
Query tuning is not just a reactive task that comes up only when there’s a performance issue. It should be a part of your regular database maintenance. Keep an eye on the emerging technologies, stay updated with the latest MySQL versions, and continuously monitor your system to preemptively address performance issues.
Data Types in MySQL: Understanding Their Importance
Why Data Types?
Data types play an essential role in defining the structure of your database tables. Each column has a data type that dictates what kind of values it can store and how those values are stored internally. Data types may also carry meta properties like size, precision, and character set. While these might seem like limitations, they offer several advantages:
Benefits of Using Data Types
- Data Validation: Helps ensure that only the expected type of data gets stored in a column.
- Documentation: Acts as implicit documentation, informing future users (or reminding you) what kind of data should go in each column.
- Optimized Storage: Different data types have different storage requirements, allowing you to optimize disk usage.
- Performance: Using the right data type can significantly speed up query performance.
- Correct Sorting: Ensures that data is sorted in a manner consistent with its type, e.g., lexicographically for strings, numerically for numbers, etc.
MySQL Data Types
MySQL supports a rich set of more than 30 data types, many of which can be fine-tuned in terms of size, precision, and sign. While it might appear overwhelming at first glance, classifying these types into categories can simplify the process of choosing the right one for your needs.
Categories of Data Types in MySQL
Numeric: This includes various types of integers, fixed and approximate precision decimal types, and bit types.
- Examples:
INT,DECIMAL,FLOAT,BIT
- Examples:
Temporal: Specialized types for representing time-based values.
- Examples:
DATE,TIME,DATETIME,TIMESTAMP,YEAR
- Examples:
Strings: Types for text-based data, which can be either binary or character-based.
- Examples:
CHAR,VARCHAR,TEXT,BLOB
- Examples:
JSON: Specifically designed to hold JSON-formatted data.
- Example:
JSON
- Example:
Spatial: Geometric types for storing multi-dimensional data.
- Examples:
POINT,LINESTRING,POLYGON
- Examples:
Hybrid: These are unique types that can function as both integers and strings.
- Examples:
ENUM,SET
- Examples:
By understanding these categories and the specific types within them, you can more effectively choose the right data types for your MySQL database.
Indexes
What Is an Index?
An index in MySQL is a specialized data structure that significantly speeds up data retrieval operations. Behind the scenes, MySQL uses a B-tree or hash-based algorithm to make sure data lookups happen as quickly as possible. Indexes are essential for optimizing SELECT queries but come with trade-offs, such as increased storage and update costs.
CREATE INDEX idx_lastname ON employees(last_name);
Index Concepts
Key Versus Index
Keys and indexes in MySQL are often conflated but serve distinct roles. A key is a constraint imposed on the data for the purpose of maintaining data integrity. An index, on the other hand, is a performance optimization feature that speeds up data retrieval.
ALTER TABLE employees ADD PRIMARY KEY (employee_id);
CREATE INDEX idx_firstname ON employees(first_name);
Unique Index
A Unique Index ensures that all values in the index are distinct. It’s like a standard index but adds a constraint that forbids duplicate values, which can be beneficial for data integrity and also for query performance.
CREATE UNIQUE INDEX idx_unique_email ON employees(email);
Primary Key
The Primary Key is a special case of a unique index. Not only does it enforce a unique constraint, but it also establishes the default way to access the data. A table can have only one primary key, and it is automatically a clustered index in InnoDB storage engine.
ALTER TABLE employees ADD PRIMARY KEY (employee_id);
Secondary Indexes
These are the indexes that are not primary keys. Secondary indexes are used often for queries that do not involve the primary key. They can also be partial or composite, covering only a subset of columns.
CREATE INDEX idx_department ON employees(department);
Clustered Index
InnoDB tables have a special index called the clustered index that reorders the way records in the table are physically stored. Thus, the table data is stored in order based on the clustered index, making data retrieval more efficient.
-- In InnoDB, the PRIMARY KEY serves as the clustered index
ALTER TABLE employees ADD PRIMARY KEY (employee_id);
Covering Index
A covering index includes all the columns retrieved by a query, meaning that the index alone is enough to satisfy the query. This eliminates the need to read the actual table, speeding up the query considerably.
-- The following query can be satisfied using a covering index on (first_name, last_name)
SELECT first_name, last_name FROM employees WHERE first_name = 'John';
Index Limitations
Indexes can be a boon for query performance, but they are not a silver bullet. There are limitations like storage overhead, write performance overhead, and sometimes, sub-optimal query planning due to the presence of multiple indexes. Understanding these limitations is crucial for effective index management.
-- An example where having an index on a very frequently updated column can be detrimental
UPDATE employees SET last_modified = NOW();
SQL Syntax
Creating Tables with Indexes
You can define indexes right at the time of table creation, specifying which columns should be indexed, and what type of index should be used. This is a good practice when you already have an idea of the query workload.
CREATE TABLE orders (
    order_id INT PRIMARY KEY,
    customer_id INT,
    amount DECIMAL(10, 2),
    INDEX (customer_id)
);
Adding Indexes
If you need to add an index to an existing table, you can do so using the ALTER TABLE statement or the CREATE INDEX statement. The latter is more readable and explicit about its purpose.
ALTER TABLE employees ADD INDEX idx_lastname (last_name);
-- OR
CREATE INDEX idx_lastname ON employees(last_name);
Removing Indexes
Indexes can be dropped if they are no longer needed, or if they are causing performance issues. This is done using the DROP INDEX statement.
DROP INDEX idx_lastname ON employees;
What Are the Drawbacks of Indexes?
Storage
Every index you add creates a separate data structure that takes up disk space. As your table grows, so does the size of your indexes. This can lead to increased storage costs and potential I/O overhead. Keep an eye on disk usage, especially in large tables
Updating the Index
Write operations (INSERT, UPDATE, DELETE) have to update the indexes as well, which can slow down these operations. The more indexes you have, the slower your write operations will be.
-- An example of how multiple indexes can slow down an insert operation
INSERT INTO employees (first_name, last_name, department) VALUES ('John', 'Doe', 'Engineering');
The Optimizer
MySQL’s Query Optimizer might sometimes choose an inefficient index or skip using an index altogether for complex queries. This can lead to suboptimal query performance, requiring manual query hints or index modifications.
-- Example forcing the optimizer to use a particular index
SELECT * FROM employees FORCE INDEX (idx_lastname) WHERE last_name = 'Smith';
Index Types
B-tree Indexes
The default and most commonly used index type in MySQL is the B-tree index. B-tree indexes are optimal for high-cardinality data and are excellent for range queries. Under the hood, MySQL utilizes a specific variant known as a B+ tree2.
-- Creating a B-tree index on the `employee_id` column
CREATE INDEX idx_employee_id ON employees(employee_id);
-- Range query benefiting from B-tree index
SELECT * FROM employees WHERE employee_id BETWEEN 1000 AND 2000;
Full Text Indexes
Full-text3 indexes are specifically designed for text-based search queries. They’re essential for implementing features like search engines within applications. MySQL uses natural language search algorithms to facilitate this2.
-- Creating a full-text index
ALTER TABLE articles ADD FULLTEXT idx_title (title);
-- Using a full-text search query
SELECT * FROM articles WHERE MATCH(title) AGAINST('MySQL');
Spatial Indexes (R-tree Indexes)
Spatial indexes are used for spatial data types and are optimized for queries that retrieve data within a geometric space. These utilize R-tree data structures4.
-- Creating a spatial index
ALTER TABLE geom ADD SPATIAL INDEX idx_coordinates (coordinates);
-- Query using spatial index
SELECT * FROM geom WHERE MBRContains(coordinates, POINT(10, 10));
Multi-valued Indexes
MySQL also supports multi-valued indexes which are useful for handling arrays of values within a single column, often in conjunction with JSON data types.
-- Creating a multi-valued index
CREATE INDEX idx_tags ON articles((CAST(tags AS JSON ARRAY)));
-- Query using multi-valued index
SELECT * FROM articles WHERE JSON_CONTAINS(tags, '"mysql"');
Hash Indexes
Hash indexes5 are memory-based and are thus extremely fast for exact match queries. However, they are not useful for range queries.
-- Creating a hash index
CREATE INDEX idx_employee_id_hash ON employees(employee_id) USING HASH;
-- Exact match query benefiting from hash index
SELECT * FROM employees WHERE employee_id = 101;
Index Features
Functional Indexes
Functional indexes allow you to index the result of a function or expression, thereby making your queries more efficient when using these expressions. MySQL uses functional indexes mainly to optimize queries that rely on some calculation or transformation of data.
-- Creating a functional index
CREATE INDEX idx_year_birthdate ON employees(YEAR(birthdate));
-- Query benefiting from functional index
SELECT * FROM employees WHERE YEAR(birthdate) = 1980;
Prefix Indexes
Prefix indexes index only a part of a string column. This is particularly useful for TEXT and BLOB data types, which can be very large. Prefix indexing allows you to make a trade-off between query performance and storage requirements.
-- Creating a prefix index
CREATE INDEX idx_name_prefix ON employees(name(10));
-- Query using prefix index
SELECT * FROM employees WHERE name LIKE 'Joh%';
Invisible Indexes
MySQL allows you to mark an index as invisible, which makes it unavailable for the optimizer to use but still maintained as data is modified. This is very useful for testing the impact of removing an index without actually deleting it.
-- Making an index invisible
ALTER TABLE employees ALTER INDEX idx_employee_id INVISIBLE;
-- Making it visible again
ALTER TABLE employees ALTER INDEX idx_employee_id VISIBLE;
Descending Indexes
While most indexes are in ascending order by default, MySQL also allows you to create descending indexes. This is useful for optimizing queries that sort data in descending order.
-- Creating a descending index
CREATE INDEX idx_salary_desc ON employees(salary DESC);
-- Query benefiting from descending index
SELECT * FROM employees ORDER BY salary DESC;
Partitioning and Indexes
Partitioning splits a table into smaller, more manageable pieces, called partitions. Indexes can be created on these partitions to further improve performance. Each partition can be indexed separately, thus allowing more parallelism and speed.
-- Creating a partitioned table with index
CREATE TABLE employees_partitioned (
  id INT,
  name VARCHAR(50),
  salary INT,
  INDEX idx_salary (salary)
) PARTITION BY RANGE (salary) (
  PARTITION p0 VALUES LESS THAN (50000),
  PARTITION p1 VALUES LESS THAN (100000)
);
Auto-generated Indexes
Some types of table constraints will automatically generate indexes. For example, a UNIQUE constraint will implicitly create a unique index on the relevant column.
-- Auto-generating a unique index due to UNIQUE constraint
CREATE TABLE employees_unique (
  id INT UNIQUE,
  name VARCHAR(50)
);
InnoDB and Indexes
The Clustered Index
InnoDB tables have a special index known as the Clustered Index. This index sorts and stores the data rows based on their primary key. As a result, operations like lookups and range-based queries are highly optimized.
-- Example showcasing the clustered index via the primary key
CREATE TABLE employees_innodb (
  id INT PRIMARY KEY,
  name VARCHAR(50),
  salary INT
);
-- Efficient lookup due to clustered index
SELECT * FROM employees_innodb WHERE id = 5;
Secondary Indexes
In contrast to the clustered index, secondary indexes in InnoDB tables store both the column value and a reference to the corresponding primary key in the clustered index. This two-step process can sometimes result in slower queries than using just the clustered index.
-- Creating a secondary index
CREATE INDEX idx_salary_innodb ON employees_innodb(salary);
-- Query using the secondary index
SELECT * FROM employees_innodb WHERE salary >= 50000;
Recommendations
For optimal performance, it is advised to use the clustered index whenever possible. Keep the primary key as small as possible to ensure that secondary indexes remain efficient.
-- Example showing a suboptimal primary key
CREATE TABLE suboptimal_employees (
  UUID CHAR(36) PRIMARY KEY,
  name VARCHAR(50)
);
Optimal Use Cases
Clustered indexes are most effective for operations that retrieve a range of rows, while secondary indexes are generally better suited for filtering and sorting different columns. Know when to use each for best performance.
-- Optimal use of clustered index
SELECT * FROM employees_innodb WHERE id BETWEEN 5 AND 10;
-- Optimal use of secondary index
SELECT name FROM employees_innodb ORDER BY salary DESC;
Index Strategies
When Should You Add or Remove Indexes?
The management of indexes is a non-trivial computational task, akin to the management of sparse matrices in high-dimensional space. There exists a suite of diagnostic tools provided by MySQL to facilitate this task through a data-driven approach.
schema_tables_with_full_table_scans
This table serves as a diagnostic tool to identify inefficiencies, particularly those involving full-table scans. It aims to provide an empirical basis for identifying tables where indexing is either suboptimal or non-existent.
SELECT * FROM sys.schema_tables_with_full_table_scans;
statements_with_full_table_scans
While the aforementioned table identifies tables that undergo full scans, this table goes a step further by tracing the SQL statements responsible for said scans.
SELECT * FROM sys.statements_with_full_table_scans;
*************************** 1. row ***************************
                   query: SELECT * FROM `sys` . `schema_tables_with_full_table_scans`
                      db: employees
              exec_count: 2
           total_latency: 9.75 ms
     no_index_used_count: 2
no_good_index_used_count: 0
       no_index_used_pct: 100
               rows_sent: 0
           rows_examined: 278
           rows_sent_avg: 0
       rows_examined_avg: 139
              first_seen: 2023-09-11 19:33:30.468872
               last_seen: 2023-09-11 19:34:26.145443
                  digest: 83ddb03c19128fd0524cd779ebbb2f013edfffd1d6c7cf7eb0c864b418f92f07
schema_index_statistics
Incorporates statistical measures such as ‘Cardinality’ and ‘Sub-Part Number’, which serve as proxies for index efficiency.
SELECT * FROM information_schema.statistics WHERE table_name = 'employees';
schema_unused_indexes and schema_redundant_indexes
Two utility tables that pinpoint underutilized or redundant indexes, aiding in the continuous task of schema normalization.
-- Query for unused indexes
SELECT * FROM sys.schema_unused_indexes;
*************************** 1. row ***************************
object_schema: performance_schema
  object_name: threads
   index_name: PROCESSLIST_ID
*************************** 2. row ***************************
object_schema: performance_schema
  object_name: threads
   index_name: THREAD_OS_ID
-- Query for redundant indexes
SELECT * FROM sys.schema_redundant_indexes;
*************************** 1. row ***************************
              table_schema: employees
                table_name: dept_manager
      redundant_index_name: dept_no2
   redundant_index_columns: dept_no,emp_no
redundant_index_non_unique: 1
       dominant_index_name: dept_no
    dominant_index_columns: dept_no,emp_no
 dominant_index_non_unique: 1
            subpart_exists: 0
            sql_drop_index: ALTER TABLE `employees`.`dept_manager` DROP INDEX `dept_no2`
*************************** 2. row ***************************
              table_schema: employees
                table_name: dept_manager
      redundant_index_name: dept_no_2
   redundant_index_columns: dept_no
redundant_index_non_unique: 1
       dominant_index_name: dept_no
    dominant_index_columns: dept_no,emp_no
 dominant_index_non_unique: 1
            subpart_exists: 0
            sql_drop_index: ALTER TABLE `employees`.`dept_manager` DROP INDEX `dept_no_2`
Choice of the Primary Key
The selection of an appropriate primary key involves a computational complexity trade-off. It affects not only the organization of the clustered index but also has implications for secondary index design.
Adding Secondary Indexes
Secondary indexes serve as auxiliary data structures to improve query performance. However, these come at the cost of additional storage and maintenance overhead.
ALTER TABLE your_table ADD INDEX your_index (your_column);
Multicolumn Index
Also known as composite indexes, these indexes span multiple columns, serving queries that filter on multiple attributes.
ALTER TABLE your_table ADD INDEX your_multi_column_index (column1, column2);
Covering Indexes
A covering index is an index that includes all the columns that are needed to process a particular query. This optimization minimizes disk I/O operations, leveraging the principle of data locality.
ALTER TABLE your_table ADD INDEX covering_index (column_to_select, column_to_where);
Index Statistics
What Are Index Statistics?
Index statistics are a collection of metrics that are crucial for query optimization in MySQL databases. These metrics contain essential information about the data distribution, data volume, and cardinality of indexes in database tables. By utilizing these statistics, the query optimizer can make informed decisions, thereby significantly improving database performance and reducing resource consumption.
InnoDB and Index Statistics
How Statistics Are Collected
InnoDB utilizes a sophisticated algorithm to gather statistics about indexes. Unlike other storage engines, InnoDB employs both “random dives” and “full index scans” to collect these statistics. Random dives involve selecting random leaf pages and making estimations based on those. Full index scans are more comprehensive and collect data from every leaf page.
The choice between these two methods can be influenced by the innodb_stats_method configuration option.
-- To set statistics collection method
SET GLOBAL innodb_stats_method='nulls_equal';
nulls_equal: In this case, all NULL values are considered the same. This is the default. If you are not sure which value to choose, choose nulls_equal.
nulls_unequal: In this case, NULL values are considered different values.
nulls_ignored: In this case, NULL values are ignored when collecting the statistics.
Output for setting the stats method will not be visible directly, as this is a global server setting change.
Sample Pages
InnoDB offers the innodb_stats_sample_pages configuration to specify the number of index pages to sample when estimating cardinality. A higher number increases the accuracy but comes at the cost of computational time.
-- Setting the number of pages to sample for statistics
SET GLOBAL innodb_stats_sample_pages=45;
Transaction Isolation Level
The Transaction Isolation Level significantly affects the collection of statistics. A low isolation level like READ COMMITTED ensures that the statistics are more up-to-date, reflecting even the uncommitted data. This might be useful for highly volatile tables.
-- Setting the transaction isolation level
SET TRANSACTION ISOLATION LEVEL READ COMMITTED;
Configuring Statistics Type
innodb_stats_persistent
The persistence of statistics across server restarts can be managed using the innodb_stats_persistent global variable. Persistent statistics help in maintaining consistent query performance.
-- Enabling persistent statistics
SET GLOBAL innodb_stats_persistent = ON;
STATS_PERSISTENT Table Option
For a more fine-grained control, MySQL allows you to set statistics persistence at the table level using the STATS_PERSISTENT table option.
-- Enabling persistent statistics for a specific table
ALTER TABLE your_table_name STATS_PERSISTENT = 1;
In this enriched section, the details about how InnoDB collects, manages, and utilizes index statistics have been expanded. The control knobs and configurations available to database administrators for manipulating these statistics have also been elucidated. Understanding these facets is not just an academic exercise but a requisite for mastering the art of MySQL performance tuning.
Persistent Index Statistics
Persistent Index Statistics in MySQL’s InnoDB engine serve as an important mechanism for storing vital statistics related to indexes. These statistics persist even after server reboots, enabling the optimizer to make informed decisions promptly. This is critical for environments that require high uptime and consistent performance.
Configuration
Here, we discuss the essential configurations pertaining to persistent index statistics.
innodb_stats_persistent_sample_pages
This setting dictates the number of index leaf pages to sample when estimating cardinalities and other index statistics. The choice of the sample size can profoundly impact the optimizer’s query plans.
-- To configure the number of sampled pages for persistent statistics
SET GLOBAL innodb_stats_persistent_sample_pages = 24;
innodb_stats_auto_recalc
When set to ON, this option enables the automatic recalculation of index statistics whenever there is a substantial change in the underlying table data. This is crucial for keeping statistics in sync with the real state of the data.
-- To turn on automatic recalculation of persistent index statistics
SET GLOBAL innodb_stats_auto_recalc = ON;
innodb_stats_include_delete_marked
By setting this to ON, statistics will also consider records that have been marked for deletion but not yet purged. This can offer more comprehensive statistics but may include “noise.”
-- To include records marked for deletion in statistics
SET GLOBAL innodb_stats_include_delete_marked = ON;
STATS_AUTO_RECALC
This table-level option specifies whether the persistent statistics for that particular table should be automatically recalculated.
-- To enable automatic recalculation for a specific table
ALTER TABLE your_table_name STATS_AUTO_RECALC = 1;
STATS_SAMPLE_PAGES
This table-level option indicates the number of index sample pages for a table when calculating persistent statistics.
-- To set sample pages for a particular table
ALTER TABLE your_table_name STATS_SAMPLE_PAGES = 10;
Index Statistics Tables
These are system tables where MySQL stores the computed index statistics.
innodb_index_stats table
The innodb_index_stats table keeps various statistical data about indexes.
-- To query index statistics
SELECT index_name, stat_name,
              stat_value, sample_size,
              stat_description
         FROM mysql.innodb_index_stats
        WHERE database_name = 'employees'
              AND table_name = 'salaries';
*************************** 1. row ***************************
      index_name: PRIMARY
       stat_name: n_diff_pfx01
      stat_value: 300557
     sample_size: 20
stat_description: emp_no
*************************** 2. row ***************************
      index_name: PRIMARY
       stat_name: n_diff_pfx02
      stat_value: 2838426
     sample_size: 20
stat_description: emp_no,from_date
*************************** 3. row ***************************
      index_name: PRIMARY
       stat_name: n_leaf_pages
      stat_value: 6078
     sample_size: NULL
stat_description: Number of leaf pages in the index
*************************** 4. row ***************************
      index_name: PRIMARY
       stat_name: size
      stat_value: 6120
     sample_size: NULL
stat_description: Number of pages in the index
n_diff_pfxNN: The cardinality for the first NN columns in the index. NN is 1-based, so for an index with two columns, n_diff_pfx01 and n_diff_pfx02 exist. For the rows with these statistics, stat_description includes the columns included for the statistic.n_leaf_pages: The total number of leaf pages in the index. You can compare this to the sample size for the n_diff_pfxNN statistics to determine the fraction of the index that has been sampled.size: The total number of pages in the index. This includes non-leaf pages.
Querying mysql.innodb_table_stats
The mysql.innodb_table_stats table is a repository of metadata and statistical information about InnoDB tables. This table is automatically updated by InnoDB and holds a wealth of information that can be critical for performance tuning and diagnostics. Notably, the optimizer uses this information to construct more effective query plans.
Key Columns in mysql.innodb_table_stats
database_name: The name of the database where the table resides.table_name: The name of the table being described.last_update: Timestamp indicating the last update to the statistics.n_rows: Approximation of the number of rows in the table.clustered_index_size: The size, in pages, of the table’s clustered index.sum_of_other_index_sizes: Sum of the sizes of all non-clustered indexes for the table.
-- Query to get all available statistics for a specific table
SELECT *
FROM mysql.innodb_table_stats
WHERE database_name = 'employees' AND table_name = 'salaries';
*************************** 1. row ***************************
           database_name: employees
              table_name: salaries
             last_update: 2023-09-07 17:29:17
                  n_rows: 2838426
    clustered_index_size: 6120
sum_of_other_index_sizes: 0
The output of this query could provide numerous insights. For example, a sudden spike in n_rows could indicate potential table bloat, and a large clustered_index_size compared to sum_of_other_index_sizes could suggest that the table might benefit from additional secondary indexes.
Practical Use-Cases
Identifying Table Size: The
clustered_index_sizeandsum_of_other_index_sizescan be used to get a fair idea of how much space a table and its indexes are consuming.Assessing Data Growth: By monitoring changes in the
n_rowsover time, you can predict the rate at which your table is growing and plan for scale accordingly.
-- Query to monitor data growth
SELECT database_name, table_name, n_rows
FROM mysql.innodb_table_stats
ORDER BY last_update DESC;
- Optimizer Diagnostics: If queries seem suboptimal, checking the
last_updatetimestamp can provide clues. If the statistics are stale, you may need to manually update them for the optimizer to make more accurate plans.
-- Query to find stale statistics based on last update
SELECT database_name, table_name, last_update
FROM mysql.innodb_table_stats
WHERE last_update < DATE_SUB(NOW(), INTERVAL 1 WEEK);
Monitoring Indexes in MySQL
Monitoring is an indispensable activity for any MySQL DBA, especially when dealing with index-related performance issues. The ability to accurately gauge the state of indexes can be crucial for proactive optimization. MySQL offers various avenues to monitor indexes, and knowing how to leverage these tools can give you a distinct advantage.
Information Schema STATISTICS View
The Information Schema STATISTICS view provides detailed statistics and metadata for index usage. It includes crucial columns like TABLE_NAME, INDEX_NAME, COLUMN_NAME, CARDINALITY, and many others which give you an insight into the indexes of all tables.
-- Query to view statistics for a specific table
SELECT INDEX_NAME, NON_UNIQUE,
	SEQ_IN_INDEX, COLUMN_NAME,
	CARDINALITY, INDEX_TYPE,
	IS_VISIBLE
	FROM information_schema.STATISTICS WHERE TABLE_SCHEMA = 'employees' AND TABLE_NAME = 'salaries';
*************************** 1. row ***************************
  INDEX_NAME: PRIMARY
  NON_UNIQUE: 0
SEQ_IN_INDEX: 1
 COLUMN_NAME: emp_no
 CARDINALITY: 300557
  INDEX_TYPE: BTREE
  IS_VISIBLE: YES
*************************** 2. row ***************************
  INDEX_NAME: PRIMARY
  NON_UNIQUE: 0
SEQ_IN_INDEX: 2
 COLUMN_NAME: from_date
 CARDINALITY: 2838426
  INDEX_TYPE: BTREE
  IS_VISIBLE: YES
This query is essential for understanding what indexes exist for a table and how they are structured.
The SHOW INDEX Statement
The SHOW INDEX statement is another versatile tool for inspecting indexes.
-- Simple SHOW INDEX query
SHOW INDEX FROM salaries IN employees;
*************************** 1. row ***************************
        Table: salaries
   Non_unique: 0
     Key_name: PRIMARY
 Seq_in_index: 1
  Column_name: emp_no
    Collation: A
  Cardinality: 300557
     Sub_part: NULL
       Packed: NULL
         Null:
   Index_type: BTREE
      Comment:
Index_comment:
      Visible: YES
   Expression: NULL
*************************** 2. row ***************************
        Table: salaries
   Non_unique: 0
     Key_name: PRIMARY
 Seq_in_index: 2
  Column_name: from_date
    Collation: A
  Cardinality: 2838426
     Sub_part: NULL
       Packed: NULL
         Null:
   Index_type: BTREE
      Comment:
Index_comment:
      Visible: YES
   Expression: NULL
The output of this command will give you a succinct but comprehensive overview of all indexes on the specified table, including the types of indexes and their uniqueness.
Understanding Cardinality
Cardinality refers to the uniqueness of data values contained in a particular column or index. A high cardinality means that the column contains a large number of unique values, whereas low cardinality implies many repeated values. Understanding cardinality is essential for two main reasons:
- Query Optimization: Indexes with high cardinality are generally more efficient for query operations, as they allow the database engine to narrow down the data set quicker.
- Storage Impact: Low cardinality might lead to inefficient indexes, consuming more storage with less query performance benefit.
The SHOW INDEX statement and INFORMATION_SCHEMA.STATISTICS view provide cardinality information. For example:
Both queries will return a CARDINALITY column, representing an estimated number of unique values in the index. Keep in mind that these are approximations and can be updated, will be covered after this section how to update table.
The Information Schema INNODB_TABLESTATS View
The INNODB_TABLESTATS view is specific to InnoDB tables and provides metrics that are crucial for performance tuning.
-- Querying INNODB_TABLESTATS
SELECT * FROM INFORMATION_SCHEMA.INNODB_TABLESTATS WHERE name like 'employees%';
*************************** 5. row ***************************
         TABLE_ID: 1075
             NAME: employees/salaries
STATS_INITIALIZED: Initialized
         NUM_ROWS: 2838426
 CLUST_INDEX_SIZE: 6120
 OTHER_INDEX_SIZE: 0
 MODIFIED_COUNTER: 0
          AUTOINC: 0
        REF_COUNT: 2
The returned metrics could include statistics about the number of rows, disk space utilization, and other metadata that could be vital for performance analysis.
The Information Schema TABLES View and SHOW TABLE STATUS
Both INFORMATION_SCHEMA.TABLES and the SHOW TABLE STATUS statement provide a general overview of tables which includes statistics on indexes.
-- Using the TABLES view
SELECT TABLE_NAME, TABLE_ROWS, AVG_ROW_LENGTH, DATA_LENGTH, INDEX_LENGTH
FROM INFORMATION_SCHEMA.TABLES
WHERE TABLE_SCHEMA = 'employees' and TABLE_NAME = 'salaries';
*************************** 1. row ***************************
    TABLE_NAME: salaries
    TABLE_ROWS: 2838426
AVG_ROW_LENGTH: 35
   DATA_LENGTH: 100270080
  INDEX_LENGTH: 0
1 row in set (0.00 sec)
-- Using SHOW TABLE STATUS
SHOW TABLE STATUS IN employees;
*************************** 1. row ***************************
           Name: salaries
         Engine: InnoDB
        Version: 10
     Row_format: Dynamic
           Rows: 2838426
 Avg_row_length: 35
    Data_length: 100270080
Max_data_length: 0
   Index_length: 0
      Data_free: 4194304
 Auto_increment: NULL
    Create_time: 2023-09-07 17:28:40
    Update_time: NULL
     Check_time: NULL
      Collation: utf8mb4_0900_ai_ci
       Checksum: NULL
 Create_options:
        Comment:
While these commands offer broader information about the table, they also include index length which can be used for estimating the space utilization of indexes.
Updating the Statistics
Automatic Updates
InnoDB automatically updates index statistics during various operations. These updates can be triggered by:
Rows Changed: Statistics get updated automatically when a significant number of rows are changed (inserted, deleted, or updated).
Minimum Time Between Updates Due to Changed Rows: InnoDB may not update statistics immediately for every change. It often waits for either a certain amount of time or a particular percentage change in the data.
Other Actions Triggering Changes: Operations like
OPTIMIZE TABLEcan trigger statistics updates.Background Updates: InnoDB periodically updates statistics in the background to reflect data changes over time.
Configuration: Various system variables like
innodb_stats_on_metadataandinnodb_stats_persistent_sample_pagescontrol how and when statistics are updated.
Here is an example to set a system variable:
SET GLOBAL innodb_stats_on_metadata=0;
The ANALYZE TABLE Statement
The ANALYZE TABLE statement is a manual way to update table and index statistics. When executed, it refreshes the index statistics and updates the table cache values. The utility of this statement becomes evident when you do not want to rely on the automated, delayed update mechanism.
ANALYZE TABLE salaries;
This command is especially useful if you’ve recently performed bulk inserts, deletes, or updates. The forced update of statistics leads to more accurate query optimization.
The mysqlcheck Program
Another way to update table statistics is via the mysqlcheck6 program. This utility allows for checking, repairing, optimizing, and analyzing tables. To update statistics for a table, you can run:
mysqlcheck -a employees salaries -u mysql -p
Enter password: *****
employees.salaries                                 OK
The -a option stands for “analyze,” and running this command will have the same effect as running an ANALYZE TABLE statement.
The -u option stands for “user”
The -p option stands for “password”
Histograms
What Are Histograms
Histograms in MySQL serve as a statistical representation of data distribution in a table column. They are useful for the optimizer to make better decisions on query execution plans without scanning the entire table.
When Should You Add Histograms
Histograms should be considered when:
- Queries have complex filters.
- Columns contain non-uniform distribution7.
- Statistics aren’t updated frequently enough to represent current data distribution.
Histogram Internals
Buckets
Histograms are made of buckets, each representing a range of column values. The optimizer uses these buckets to estimate the number of rows for different query conditions.
Cumulative Frequencies
Different types of queries utilize cumulative frequencies in unique ways:
- Less Than: The cumulative frequency for the previous value is used.
- Less Than or Equal: The cumulative frequency of the value in the condition is used.
- Greater Than or Equal: The cumulative frequency of the previous value subtracted from 1.
- Greater Than: The cumulative frequency of the value in the condition is subtracted from 1.
Histogram Types
Singleton
In singleton histograms, there is exactly one value per bucket. This makes them highly accurate for columns where each value is unique or nearly so.
It will be singelton when number of columns is less than number of buckets.
ANALYZE TABLE departments UPDATE HISTOGRAM ON dept_name WITH 100 BUCKETS;
*************************** 1. row ***************************
   Table: employees.departments
      Op: histogram
Msg_type: Error
Msg_text: The column 'dept_name' is covered by a single-part unique index.
Equi-height
When there are more values for the column than there are buckets, MySQL will distribute the values, so each bucket roughly has the same number of rows – that is, each bucket will be roughly the same height. Since all rows with the same value are distributed to the same bucket, the buckets will not be exactly the same height. For equi-height histograms, there are a different number of values represented for each bucket.
ANALYZE TABLE salaries UPDATE HISTOGRAM ON salary WITH 100 BUCKETS FOR TYPE 'EQUI-HEIGHT';
*************************** 1. row ***************************
   Table: employees.salaries
      Op: histogram
Msg_type: status
Msg_text: Histogram statistics created for column 'salary'.
1 row in set (0.24 sec)
The Query Optimizer
The Query Optimizer in MySQL is the component responsible for taking SQL queries as input and producing an optimized query execution plan, which the database engine uses to fetch or modify data.
Transformations
The optimizer first performs various transformations to simplify the query without changing its semantics. This includes constant folding, predicate pushdown, and join reordering, among other techniques.
-- Original Query
SELECT * FROM employees WHERE YEAR(hire_date) = 2021 AND dept = 'HR';

-- Transformed Query
SELECT * FROM employees WHERE hire_date BETWEEN '2021-01-01' AND '2021-12-31' AND dept = 'HR';
Cost-Based Optimization
MySQL uses a cost-based approach to optimize queries, evaluating multiple possible execution plans and selecting the least costly in terms of expected resource usage.
The Basics: Single Table SELECT
When dealing with a single-table SELECT query, the optimizer has to answer several key questions:
How selective is the index?
Selectivity is the ability of an index to filter out a large number of rows with minimal I/O. It is usually defined as the ratio of unique values to the total number of rows. An index with high selectivity is desirable.
-- Query relying on a highly selective index
SELECT * FROM employees WHERE employee_id = 2001;
Is the index a covering index?
A covering index includes all the columns needed to execute a query, thus eliminating the need for additional table lookups. This is highly efficient.
-- Creating covering index
CREATE INDEX idx_covering_employee ON employees (department, employee_id, first_name);

-- Query using a covering index
SELECT employee_id, first_name FROM employees WHERE department = 'Engineering';
How expensive is it to read records?
Reading records may involve disk I/O, which is costly in terms of performance. MySQL’s optimizer considers the cost of reading from an index versus reading from the table while deciding on an optimal execution plan.
-- Expensive query due to full table scan
SELECT * FROM employees WHERE hire_date BETWEEN '1980-01-01' AND '1985-12-31';
Table Join Order
MySQL’s optimizer also has the critical task of determining the best sequence in which to join tables when a query involves multiple joins. The sequence can significantly affect the query performance. The optimizer employs algorithms like greedy search and dynamic programming to find an efficient join order.
-- Example of a complex join query
SELECT e1.first_name, e2.first_name as manager_name
FROM employees e1
JOIN employees e2 ON e1.manager_id = e2.employee_id
WHERE e1.department = 'Engineering';
Default Filtering Effects
When generating an execution plan, the optimizer takes into account the default filtering effects provided by indexes or pre-existing conditions in the query. These can include:
Distinct values are known
When an index exists on a column with distinct values, the optimizer can make better judgments about which index to use for filtering.
-- An example where distinct values help in optimization
SELECT DISTINCT department FROM employees;
Few rows
If the optimizer knows that only a few rows will satisfy a certain condition, it may choose a full table scan over an index scan.
-- Example where knowing the number of rows affects optimization
SELECT * FROM employees WHERE department = 'Executive Office';
Combination of filters
Sometimes, multiple conditions can be combined to achieve better filtering.
-- Example using multiple filters
SELECT * FROM employees WHERE department = 'Engineering' AND years_of_service > 5;
The Query Cost
One of the most intricate aspects of query optimization is determining the ‘cost’ of a specific query or a part thereof. The term ‘cost’ is somewhat abstract but typically involves metrics such as the number of disk I/O operations, CPU cycles, and memory usage. MySQL’s Query Optimizer uses these cost metrics to choose the most efficient query execution plan.
In essence, the optimizer has a cost model, and it evaluates the cost of different execution strategies based on that model. The optimizer chooses the plan with the lowest calculated cost.
-- An example query where the optimizer would consider multiple execution paths
SELECT * FROM employees e
JOIN departments d ON e.department_id = d.id
WHERE d.name = 'Engineering'
ORDER BY e.salary DESC;
The Query Optimizer might consider using an index on the departments table for the WHERE clause and another index on the employees table for the ORDER BY clause. It will calculate the cost of each strategy: using one index but not the other, using both, or perhaps using none and opting for a full table scan if the table is small enough.
In MySQL, you can use EXPLAIN to see the estimated costs and the chosen plan for a query.
-- Using EXPLAIN to view the Query Execution Plan
EXPLAIN SELECT * FROM employees e
JOIN departments d ON e.department_id = d.id
WHERE d.name = 'Engineering'
ORDER BY e.salary DESC;
Join Algorithms
Join algorithms8 are the backbone of query execution when more than one table is involved. MySQL employs several join algorithms to efficiently retrieve data, and the Query Optimizer picks the most suitable one depending on various factors such as table size, indexing, and join conditions. Below are some of the commonly used join algorithms:
Nested Loop
The Nested Loop 9 is the most straightforward algorithm. It involves two loops, one for each joined table, resulting in a row-by-row comparison between the two tables.
-- Nested Loop Example
EXPLAIN SELECT * FROM employees e
JOIN departments d ON e.department_id = d.id;
Pseudo-Code for Nested Loop:
for each row R1 in table1 {
    for each row R2 in table2 {
        if R1 joins with R2 {
            output the joined row
        }
    }
}
Block Nested Loop
The Block Nested Loop10 improves on the Nested Loop by reducing disk I/O operations. It fetches ‘blocks’ of rows from the inner table and caches them to match against each row from the outer table.
-- To force MySQL to use BLOCK NESTED-LOOP
SET optimizer_switch = 'block_nested_loop=on';
EXPLAIN SELECT * FROM employees e
JOIN departments d ON e.department_id = d.id;
Pseudo-Code for Block Nested Loop:
for each block B1 in table1 {
    for each block B2 in table2 {
        for each row R1 in B1 {
            for each row R2 in B2 {
                if R1 joins with R2 {
                    output the joined row
                }
            }
        }
    }
}
Hash Join
The Hash Join algorithm11 creates a hash table for the smaller of the two tables, and then scans the larger table, probing the hash table for matching rows.
-- To force MySQL to use HASH JOIN
SET optimizer_switch = 'hash_join=on';
EXPLAIN SELECT * FROM employees e
JOIN departments d ON e.department_id = d.id;
Pseudo-Code for Hash Join:
create hash table on join key from smaller table
for each row R1 in larger table {
    if (find matching row R2 using hash table) {
        output the joined row
    }
}
Join Optimizations
Index Merge
Before Optimization:
Query:
EXPLAIN SELECT * FROM employees e WHERE e.first_name = 'John' OR e.last_name = 'Doe';
Indexes Available:
CREATE INDEX idx_first_name ON employees(first_name);
CREATE INDEX idx_last_name ON employees(last_name);
Optimizer’s Choice: Typically one index. This is sub-optimal.
After Optimization:
Query:
EXPLAIN SELECT * FROM employees e WHERE (e.first_name = 'John' OR e.last_name = 'Doe');
Optimizer’s Choice: Uses both idx_first_name and idx_last_name and merges the result sets, leading to more efficient query execution.
Intersection Algorithm
Before Optimization:
Query:
EXPLAIN SELECT * FROM employees e JOIN departments d ON e.department_id = d.id WHERE e.first_name = 'John' AND e.department_id = 3;
Indexes Available:
CREATE INDEX idx_first_name_department_id ON employees(first_name, department_id);
Optimizer’s Choice: Only one composite index, missing out on any existing individual indexes.
After Optimization:
Query: Same as before.
Optimizer’s Choice: Uses both the individual and composite indexes to intersect the results, thereby enhancing the query performance.
Union Algorithm
Before Optimization:
Query:
EXPLAIN SELECT * FROM employees e WHERE e.first_name = 'John' OR e.department_id = 3;
- Indexes Available:
CREATE INDEX idx_first_name ON employees(first_name);
CREATE INDEX idx_department_id ON employees(department_id);
Optimizer’s Choice: Typically one index.
After Optimization:
Query: Same as before.
Optimizer’s Choice: It utilizes both idx_first_name and idx_department_id, retrieves the records individually and then unions the result sets.
Sort-Union Algorithm
Before Optimization:
Query:
EXPLAIN SELECT * FROM employees e WHERE e.first_name = 'John' OR e.department_id = 3;
Indexes Available:
CREATE INDEX idx_first_name ON employees(first_name);
CREATE INDEX idx_department_id ON employees(department_id);
Optimizer’s Choice: One index. Inefficient merging of result sets.
After Optimization:
Query: Same as before. Optimizer’s Choice: It sorts the individual index scans before performing the union, making the final merging process efficient.
Performance Considerations
Configuration
There are several configuration parameters in MySQL that influence how indexes and query optimization work. Here are some key ones:
index_merge: This configuration allows you to enable or disable index merges.SET GLOBAL optimizer_switch='index_merge=on';index_merge_intersection: Enabling this allows the optimizer to use the index intersection algorithm.SET GLOBAL optimizer_switch='index_merge_intersection=on';index_merge_union: This configuration enables the optimizer to use the index union algorithm.SET GLOBAL optimizer_switch='index_merge_union=on';index_merge_sort_union: This controls whether the sort-union algorithm is enabled.SET GLOBAL optimizer_switch='index_merge_sort_union=on';
Multi-Range Read (MRR)
Multi-Range Read (MRR) is a MySQL optimization technique that aims to improve the efficiency of range scans on secondary indexes. Instead of reading index records one by one and then accessing the corresponding rows in the data file, MRR allows MySQL to read a range of index records and sort them by the primary key of the data file. This minimizes random disk I/O, converting it into more efficient sequential I/O.
How Does MRR Work?
When executing a query that requires a range scan on an index, MySQL has the option to use MRR. In this process, MySQL will first read the range of index entries needed to satisfy the query’s WHERE clause but won’t immediately fetch the corresponding table rows. Instead, it batches these primary key values and sorts them. After sorting, MySQL fetches the rows from the table based on the primary key, making the read operation more sequential and efficient.
Here is an example to illustrate:
-- Simple query without MRR
SELECT * FROM employees WHERE employee_id BETWEEN 101 AND 200;
In the absence of MRR, MySQL would read each index entry for employee_id between 101 and 200 and then immediately fetch the corresponding row in the data file.
-- Enabling MRR
SET optimizer_switch='mrr=on';

-- Query remains the same
SELECT * FROM employees WHERE employee_id BETWEEN 101 AND 200;
With MRR enabled, MySQL first reads all index entries for employee_id between 101 and 200, batches them, sorts them by the primary key, and then fetches the corresponding rows sequentially.
When to Use MRR
MRR is particularly useful for I/O-bound queries that require scanning a range of index values. By reducing the amount of random disk I/O, MRR can offer significant performance improvements for such queries.
Note that using MRR may increase the buffer pool’s usage as it fetches batches of rows. Make sure your system has adequate memory resources before enabling this feature.
mrr: This setting controls whether the optimizer is allowed to use the Multi-Range Read optimization. The default is ON.SET optimizer_switch='mrr=on';mrr_cost_based: This setting controls if the MRR optimization decision is based on cost. If you disable this, the optimizer will always use MRR when it is supported. The default is ON.SET optimizer_switch='mrr_cost_based=off';
Batched Key Access (BKA)
Batched Key Access (BKA) is an optimization that aims to minimize random disk I/O by sorting keys before fetching rows. This is particularly useful for join operations where large datasets are involved.
To enable BKA, you can set the optimizer switch as follows:
SET optimizer_switch='batched_key_access=on';Example Query using BKA:
EXPLAIN SELECT * FROM employees e JOIN departments d ON e.department_id = d.id;In the EXPLAIN output, you would observe that BKA is being used, reducing the number of disk reads and enhancing performance.
Other Optimizations
Condition Filtering
- Optimizer Switch:
condition_fanout_filter– enabled by default. - Optimizer Hints: None.
- EXPLAIN Output: None.
Condition filtering optimizes query performance by reducing the number of rows that need to be scanned. MySQL’s query optimizer is smart enough to understand the correlation of conditions and remove unnecessary rows earlier in the query execution plan.
Derived Merge
- Optimizer Switch:
derived_merge– enabled by default. - Optimizer Hints:
MERGE(),NO_MERGE(). - EXPLAIN Output: The query plan reflects that the derived table has been merged.
Derived merge optimization allows the query optimizer to treat derived tables (subqueries in the FROM clause) as regular tables and merge them into the outer query, reducing the overall complexity.
Engine Condition Pushdown
- Optimizer Switch:
engine_condition_pushdown– enabled by default. - Optimizer Hints: None.
- EXPLAIN Output: The warnings include information about the conditions that have been pushed down.
Engine condition pushdown allows MySQL to push conditions down to the storage engine level, reducing the amount of data that needs to be transferred and processed.
Index Condition Pushdown
- Optimizer Switch:
index_condition_pushdown– enabled by default. - Optimizer Hints:
NO_ICP(). - EXPLAIN Output: The traditional format has “Using index condition” in the Extra column, and the JSON format sets the
index_conditionfield with the index condition that is pushed.
Similar to engine condition pushdown, index condition pushdown pushes index-related conditions down to the storage engine. This enables more efficient use of indexes, improving query performance.
Index Extensions
- Optimizer Switch:
use_index_extensions– enabled by default. - Optimizer Hints: None.
- EXPLAIN Output: None.
Index Extensions enable advanced index functionalities like covering indexes and functional indexes, which can further enhance query performance.
Index Visibility
- Optimizer Switch:
use_invisible_indexes– disabled by default. - Optimizer Hints: None.
- EXPLAIN Output: None.
The index visibility feature allows you to make indexes “invisible” to the query optimizer. This is useful when you want to test the impact of an index on query performance without dropping it.
Loose Index Scan
- Optimizer Switch: None.
- Optimizer Hints:
NO_RANGE_OPTIMIZATION()disables the loose index scan optimization as well as index merges and range scans. - EXPLAIN Output: The traditional format has “Using index for group-by” in the Extra column. The JSON format sets the
using_index_for_group_byfield to true.
Loose index scans are useful for aggregate queries with GROUP BY clauses. This optimization reads only the first entry in each group of the index, reducing the number of disk seeks.
Range Access Method
- Optimizer Switch: None.
- Optimizer Hints:
NO_RANGE_OPTIMIZATION()– this also disables the loose index scan and index merge optimizations. It does, however, not disable the skip scan optimization even though that also uses range access. - EXPLAIN Output: The access method is set to
range.
Range Access Method allows the query optimizer to read a range of rows from a table, using index range scans where applicable. It provides a flexible way to read data that satisfies a range condition, thereby reducing unnecessary disk I/O.
Configuring the Optimizer
Engine Costs
MySQL provides a way to tune the optimizer’s behavior by configuring engine costs via the mysql.engine_cost table. This is an advanced feature and should be modified carefully as incorrect settings can lead to performance degradation.
select * from mysql.engine_cost;
*************************** 1. row ***************************
  engine_name: default
  device_type: 0
    cost_name: io_block_read_cost
   cost_value: NULL
  last_update: 2023-09-04 17:19:32
      comment: NULL
default_value: 1
*************************** 2. row ***************************
  engine_name: default
  device_type: 0
    cost_name: memory_block_read_cost
   cost_value: NULL
  last_update: 2023-09-04 17:19:32
      comment: NULL
default_value: 0.25
Here’s what each column represents:
engine_name: Specifies the storage engine that the cost data is associated with. The value “default” represents all storage engines that do not have specific data.
device_type: Currently not in use and must have the value
0.cost_name: Describes the type of cost. There are two supported values at present:
io_block_read_cost: Pertains to disk-based reads.memory_block_read_cost: Pertains to memory-based reads.
cost_value: The numerical cost of read operations. If set to
NULL(the default), the value stored in thedefault_valuecolumn will be used.last_update: Indicates the last time the row was updated. The timestamp is in the time zone set by the
time_zonesession variable.comment: An optional comment of up to 1024 characters, which you can use to give context or rationale for a change in cost values.
default_value: A read-only column that shows the default cost used for the operation. The default value for
io_block_read_costis1, and formemory_block_read_cost, it’s0.25.
To alter these settings, you would use SQL commands like the following:
UPDATE mysql.engine_cost
SET cost_value = 2.0
WHERE engine_name = 'InnoDB' AND cost_name = 'io_block_read_cost';
This section details the configurable aspects of MySQL’s query optimizer, which helps in fine-tuning the database performance. Always remember that changes to the optimizer should be done cautiously and preferably under the guidance of someone experienced with MySQL performance tuning.
Server Costs
To configure the optimizer’s behavior even further, MySQL also exposes server-level cost settings via the mysql.server_cost table. These settings influence the optimizer’s decision-making process across various operations. Like engine costs, modifying server costs is a sensitive operation and should be handled with caution.
select * from mysql.server_cost;
*************************** 1. row ***************************
    cost_name: disk_temptable_create_cost
   cost_value: NULL
  last_update: 2023-09-04 17:19:32
      comment: NULL
default_value: 20
*************************** 2. row ***************************
    cost_name: disk_temptable_row_cost
   cost_value: NULL
  last_update: 2023-09-04 17:19:32
      comment: NULL
default_value: 0.5
*************************** 3. row ***************************
    cost_name: key_compare_cost
   cost_value: NULL
  last_update: 2023-09-04 17:19:32
      comment: NULL
default_value: 0.05
*************************** 4. row ***************************
    cost_name: memory_temptable_create_cost
   cost_value: NULL
  last_update: 2023-09-04 17:19:32
      comment: NULL
default_value: 1
*************************** 5. row ***************************
    cost_name: memory_temptable_row_cost
   cost_value: NULL
  last_update: 2023-09-04 17:19:32
      comment: NULL
default_value: 0.1
*************************** 6. row ***************************
    cost_name: row_evaluate_cost
   cost_value: NULL
  last_update: 2023-09-04 17:19:32
      comment: NULL
default_value: 0.1
Columns in mysql.server_cost
cost_name: The name of the operation whose cost is being defined.
cost_value: The numerical cost of performing the operation. If set to
NULL, the default cost from thedefault_valuecolumn is used. The value is a floating-point number.last_update: The timestamp indicating when the cost value was last modified, reported in the time zone set by the
time_zonesession variable.comment: An optional field where you can add comments (up to 1024 characters) to explain the reasoning behind any changes in cost values.
default_value: A read-only column displaying the default cost of the operation.
Specific Costs in mysql.server_cost
disk_temptable_create_cost: Cost for creating internal temporary tables on disk. Default cost is
20.disk_temptable_row_cost: Cost of row operations for internal temporary tables created on disk. Default cost is
0.5.key_compare_cost: Cost for comparing record keys. Useful for tuning sorting behavior. Default cost is
0.05.memory_temptable_create_cost: Cost for creating internal temporary tables in memory. Default cost is
1.memory_temptable_row_cost: Cost for row operations on internal temporary tables created in memory. Default cost is
0.1.row_evaluate_cost: General cost of evaluating row conditions. Affects MySQL’s inclination to perform full table scans versus using indexes. Default cost is
0.1.
Example SQL to Update Server Costs
UPDATE mysql.server_cost
SET cost_value = 0.2
WHERE cost_name = 'row_evaluate_cost';
Here, I’ve outlined how you can adjust the server-level costs that guide the MySQL optimizer’s decision-making. Make these changes carefully and under the supervision of an experienced database administrator.
Optimizer Switches
In MySQL, optimizer switches12 provide another layer of control over query optimization. These switches act like flags that can be turned on or off to enable or disable specific optimizations. You can modify them globally or per session using the SET statement.
SET SESSION optimizer_switch = 'derived_merge=off';
If you want to change the value permanently, you can use SET PERSIST or SET PERSIST_ONLY in the same way:
SET PERSIST optimizer_switch = 'derived_merge=off';
The same principle applies if you prefer to store the value in the MySQL configuration file, for example:
[mysqld]
optimizer_switch = "derived_merge=off"
Optimizer Hints in MySQL
Optimizer hints13 in MySQL allow you to control the behavior of the query optimizer for specific queries. These hints are specified directly in the SQL query and provide a finer level of control on a per-query basis. Optimizer hints are included within /*+ ... */ comments in the query.
SELECT /*+ HINT_NAME(args) */ column1, column2 FROM table_name;
SELECT /*+ FORCE_INDEX(index_name) */ * FROM table;
Index Hints in MySQL
In MySQL, index hints are directives that are embedded within queries to inform the optimizer about the preferred choice of indexes. These hints can be used to optimize query performance when the automatic decisions made by MySQL’s query optimizer are not efficient.
IGNORE INDEX
The IGNORE INDEX hint explicitly tells the MySQL optimizer to avoid using specified indexes.
SELECT * FROM table_name IGNORE INDEX (index1, index2) WHERE column1 = 'value1';
In this example, index1 and index2 will not be considered when MySQL generates the query execution plan.
USE INDEX
The USE INDEX hint informs the optimizer to only consider the listed indexes.
SELECT * FROM table_name USE INDEX (index1, index2) WHERE column1 = 'value1';
In this example, only index1 and index2 will be considered for generating the query execution plan.
FORCE INDEX
The FORCE INDEX hint forces the optimizer to use a specific index or set of indexes. This hint essentially “forces” the optimizer’s hand, making it choose from the provided list even if it believes that a full table scan would be faster.
SELECT * FROM table_name FORCE INDEX (index1) WHERE column1 = 'value1';
In this example, index1 must be used by the optimizer when it generates the query plan.
Using Multiple Index Hints
It is possible to combine different index hints in a single query, each affecting different stages of the query processing.
SELECT *
FROM table1 USE INDEX (index1)
JOIN table2 FORCE INDEX (index2)
ON table1.col1 = table2.col2
WHERE table1.col3 = 'value1';
In this query, index1 is a hint for table1 and index2 is a hint for table2.
By using index hints, you can take control of query optimization to improve performance. However, these should be used carefully and tested thoroughly, as they can lead to less optimal query plans if not used appropriately.
Configuration Options for MySQL Optimizer
MySQL provides various configuration options to fine-tune the behavior of its query optimizer. Some of these are optimizer_prune_level and optimizer_search_depth.
optimizer_prune_level
The optimizer_prune_level option controls the heuristics of the optimizer when it prunes less-promising partial plans from its search space.
- Default Value: 1
- Range: 0 or 1
-- To set the option in a MySQL session
SET optimizer_prune_level = 1;
When this option is set to 1, the optimizer prunes less-promising search paths. When set to 0, the feature is disabled, and the optimizer explores more query execution plans, which could be time-consuming.
optimizer_search_depth
This option specifies the depth of the search tree the optimizer should explore for query plans.
- Default Value: 62
- Range: 0-62
-- To set the option in a MySQL session
SET optimizer_search_depth = 62;
A value of 0 means that the server will automatically choose the optimum search depth. Lowering this value could make the optimizer faster, but possibly at the expense of choosing less-optimal query plans.
These options can be critical in optimizing query performance, particularly for complex queries or large data sets. However, they should be used cautiously and in a well-tested environment, as improper settings could degrade performance.
Resource Groups
Retrieving Information About Resource Groups
To retrieve information about Resource Groups, you can query the information_schema.RESOURCE_GROUPS table. Key columns include:
SELECT * FROM information_schema.RESOURCE_GROUPS;
*************************** 1. row ***************************
   RESOURCE_GROUP_NAME: USR_default
   RESOURCE_GROUP_TYPE: USER
RESOURCE_GROUP_ENABLED: 1
              VCPU_IDS: 0x302D37
       THREAD_PRIORITY: 0
*************************** 2. row ***************************
   RESOURCE_GROUP_NAME: SYS_default
   RESOURCE_GROUP_TYPE: SYSTEM
RESOURCE_GROUP_ENABLED: 1
              VCPU_IDS: 0x302D37
       THREAD_PRIORITY: 0
RESOURCE_GROUP_NAME: The name of the resource group.RESOURCE_GROUP_TYPE: The type of the resource group (e.g., USER or SYSTEM).RESOURCE_GROUP_ENABLED: A flag indicating if the resource group is enabled.VCPU_IDS: The virtual CPU IDs assigned to the resource group.THREAD_PRIORITY: The thread priority for the threads in the resource group.
Managing Resource Groups
CREATE RESOURCE GROUP
To create a new resource group:
CREATE RESOURCE GROUP example_group
    TYPE = USER
    VCPU = 2,3
    THREAD_PRIORITY = 10;
ALTER RESOURCE GROUP
To modify an existing resource group:
ALTER RESOURCE GROUP example_group
    VCPU = 1,2,3,4;
DROP RESOURCE GROUP
To remove an existing resource group:
DROP RESOURCE GROUP example_group;
Assigning Resource Groups
To assign a thread to a resource group:
SET RESOURCE GROUP example_group FOR thread_id;
The use of resource groups in MySQL is primarily beneficial when the system is experiencing resource contention. However, the optimal setup for resource groups is variable and depends on a combination of hardware and query workload. Additionally, what may be optimal now could change as MySQL continues to evolve. Therefore, ongoing monitoring is crucial to gauge the impact of any adjustments.
Some general tips for utilizing resource groups effectively are:
Assign different priorities to connections to ensure that high-importance tasks are not hindered by less crucial ones.
Designate different CPU sets for threads from different applications to minimize interference.
Separate read and write threads onto different CPU sets to manage concurrency and alleviate contention, especially useful if the write threads are experiencing resource bottlenecks.
For transactions that require multiple locks, assigning a high priority can help the transaction complete faster, thereby releasing the locks sooner.
In general, resource groups are most useful when CPU resources are insufficient for parallel execution of all tasks, or when write concurrency is so high that it creates contention. For low-concurrency workloads, sticking to the default resource groups is often adequate.
Locking Theory and Monitoring
In the context of databases like MySQL, locking is an essential feature that helps ensure data integrity and consistency in multi-user environments. Locks are used to serialize access to database resources. They prevent issues like dirty reads, phantom reads, and lost updates, which can otherwise occur in a concurrent access environment.
Why Are Locks Needed?
In any database system where more than one user or application can access data, a mechanism is required to prevent conflicts and ensure consistency. For instance, consider two users trying to update the same record. Without locking, both will read the current value, make updates based on it, and then write the new value back. The last write will overwrite any changes made by the first, which leads to data inconsistency. Locks prevent these kinds of issues.
Lock Access Levels
Locks can operate at different levels of granularity:
- Global Locks: Affect the entire database.
- Table Locks: Affect only a specific table.
- Row Locks: Affect only specific rows within a table.
Lock Granularity
User-Level Locks
User-level locks are not automatically acquired by MySQL but must be explicitly requested by users. They are convenient for coordinating between different connections.
Here are some common functions used for user-level locks:
GET_LOCK(name, timeout)
This function tries to obtain a lock with a given name. If the lock is not available, it waits up to timeout seconds before giving up.
SELECT GET_LOCK('my_lock', 10);
IS_FREE_LOCK(name)
This function checks if a lock with a given name is free.
SELECT IS_FREE_LOCK('my_lock');
IS_USED_LOCK(name)
This function returns the connection ID of the client that holds the lock. If no one holds the lock, it returns NULL.
SELECT IS_USED_LOCK('my_lock');
RELEASE_ALL_LOCKS()
This function releases all the locks currently held by the connection.
SELECT RELEASE_ALL_LOCKS();
RELEASE_LOCK(name)
This function releases the lock with the given name. It returns 1 if the lock was released, 0 if the lock was not established by this thread (in which case the lock is not released), and NULL if the named lock did not exist.
SELECT RELEASE_LOCK('my_lock');
Each of these functions plays a crucial role in controlling and monitoring locks at the user level, allowing for a more granular and customizable approach to data consistency.
By understanding the types of locks and their granularity, you can better design your MySQL applications to run in a performant and reliable manner.
Additional Types of Locks in MySQL
Flush Locks
Flush locks are used internally during operations like flushing tables to disk. This type of lock prevents other sessions from reading or writing to the table during the flush operation, ensuring data integrity.
Example:
FLUSH TABLES WITH READ LOCK;
Metadata Locks
Metadata locks are automatically acquired when accessing tables or other database objects like stored procedures. They ensure that no conflicting DDL (Data Definition Language) operations are performed simultaneously.
For example, if one session is reading from a table, a metadata lock will prevent another session from dropping the table.
Explicit Table Locks
Explicit table locks are specified by the user using the LOCK TABLES and UNLOCK TABLES commands.
Example:
LOCK TABLES table_name READ;
-- Perform operations
UNLOCK TABLES;
Implicit Table Locks
Implicit table locks are automatically acquired during the execution of SQL statements like SELECT, UPDATE, DELETE, etc. You don’t need to explicitly request or release these locks.
Record Locks
These are the most granular level of locks and are automatically set during operations like SELECT ... FOR UPDATE.
Example:
SELECT * FROM table_name WHERE column_name = value FOR UPDATE;
Gap Locks, Next-Key Locks, and Predicate Locks
Gap Locks
Gap locks in MySQL’s InnoDB storage engine are locks on a range of index records, but not the actual records themselves. They are set to prevent phantom reads, which can occur when new index records are inserted into a range that a transaction is scanning. Gap locks ensure that no new records can be inserted into the “gap” covered by the lock until the transaction that holds the lock is committed or rolled back.
SELECT * FROM employees WHERE salary BETWEEN 50000 AND 60000 FOR UPDATE;
Next-Key Locks
Next-key locks are a combination of a record lock on an index record and a gap lock on the gap that precedes that index record. This dual lock makes it a powerful mechanism for preventing phantom reads and ensuring that ranges of records are locked to a transaction so that other transactions can neither insert into the gap nor lock the index record itself.
SELECT * FROM employees WHERE id = 5 FOR UPDATE;
Predicate Locks
Predicate locks are more of a conceptual idea than a specific type of lock implemented in InnoDB. The term is often used in the context of Serializable Isolation Levels in some databases to indicate that a certain condition is locked. Predicate locks would lock a certain “predicate” (e.g., WHERE salary > 50000) so that other transactions can’t insert, update, or delete rows that match that condition. However, it’s worth noting that MySQL’s InnoDB does not implement predicate locks as such but instead relies on next-key and gap locks to achieve similar outcomes.
Insert Intention Locks
These locks indicate that a transaction intends to insert a new record into a specific gap. It allows multiple transactions to insert multiple records into the same gap, but prevents other types of locks that would conflict.
Auto-increment Locks
Auto-increment locks are applied when an auto-increment column is used during an INSERT operation. They ensure that each new record gets a unique, incremental value.
Backup Locks
Backup locks are used during backup operations to ensure consistency of the data being backed up. They are less restrictive than global locks, allowing certain types of operations to continue.
Log Locks
These locks are used internally to synchronize access to the transaction log. Users generally don’t interact with these directly.
Understanding the various types of locks in MySQL allows you to write applications that are both performant and provide strong data consistency guarantees.
Failure to Obtain Locks
The failure to obtain a lock generally results in the current transaction being put into a waiting state. This can occur for several reasons such as high contention for resources or deadlocks.
Metadata and Backup Lock Wait Timeouts
When you’re trying to obtain a metadata or backup lock and another session holds conflicting locks, MySQL will wait for a specified timeout period before aborting the operation. You can configure the metadata lock wait timeout using the lock_wait_timeout system variable.
Example to set the timeout:
SET SESSION lock_wait_timeout = 50;
InnoDB Lock Wait Timeouts
For InnoDB tables, the innodb_lock_wait_timeout system variable controls how long InnoDB waits for a lock to be freed before rolling back the transaction. By default, the timeout is 50 seconds.
Example to set the InnoDB lock wait timeout:
SET SESSION innodb_lock_wait_timeout = 60;
Deadlocks
A deadlock occurs when two or more transactions are waiting for each other to release a lock, creating a cycle that cannot be broken. InnoDB automatically detects deadlocks and rolls back one of the transactions to break the cycle. You can use the SHOW ENGINE INNODB STATUS command to get information about the most recent deadlock.
Example:
SHOW ENGINE INNODB STATUS;
Understanding these different aspects of lock failure, timeouts, and deadlocks will help you better manage concurrency in your MySQL applications and handle exceptions and issues that arise.
Reduce Locking Issues
Locking issues can significantly impact the performance and reliability of a database. Here are some strategies to reduce such issues.
Transaction Size and Age
Smaller transactions are generally less likely to encounter locking conflicts. Longer transactions hold locks for a more extended period, increasing the potential for conflicts. Therefore, keep your transactions as short as possible.
Indexes
Proper indexing can reduce the number of rows scanned and locked, thus reducing the chance of lock contention. Make sure to analyze your queries and use indexes effectively.
CREATE INDEX idx_column ON table_name (column_name);
Record Access Order
When multiple transactions update multiple tables or rows, try to enforce a uniform order to access records. This approach minimizes the chances of deadlocks.
Transaction Isolation Levels
The choice of transaction isolation level can impact the number of locks acquired. For example, READ COMMITTED acquires fewer locks than SERIALIZABLE.
Example to set isolation level:
SET TRANSACTION ISOLATION LEVEL READ COMMITTED;
Preemptive Locking
Sometimes it makes sense to proactively acquire all the locks you’ll need at the beginning of a transaction, to reduce the likelihood of conflicts and deadlocks.
SELECT * FROM table_name WHERE condition FOR UPDATE;
Implementing these strategies can help in reducing the chances of running into locking issues, thus making your MySQL database more efficient and reliable.
Monitoring Locks
Monitoring is crucial for identifying and solving lock-related issues. MySQL provides various tools for this purpose.
The Performance Schema
The Performance Schema provides detailed information about locks.
data_locks
The data_locks table shows currently held data locks.
SELECT * FROM performance_schema.data_locks;
data_lock_waits
The data_lock_waits table shows which data locks are being waited for.
SELECT * FROM performance_schema.data_lock_waits;
metadata_locks
The metadata_locks table provides information about metadata locks.
SELECT * FROM performance_schema.metadata_locks;
table_handles
The table_handles table can be queried to find information related to table locks.
SELECT * FROM performance_schema.table_handles WHERE OBJECT_SCHEMA = 'your_db_name';
The sys Schema
The sys schema offers several views that can be useful for lock monitoring.
SELECT * FROM sys.schema_table_lock_waits;
Status Counters and InnoDB Metrics
MySQL and InnoDB metrics can give insight into lock behaviors.
SHOW STATUS LIKE 'Innodb_row_lock%';
InnoDB Lock Monitor and Deadlock Logging
You can enable the InnoDB Lock Monitor to get information about the most recent deadlock by using the SHOW ENGINE INNODB STATUS command.
SHOW ENGINE INNODB STATUS;
Monitoring locks using these methods will help you keep a pulse on your MySQL database’s health, identify bottlenecks, and troubleshoot issues more effectively.
Finding Candidate Queries for Optimization
To optimize the database, it’s crucial to identify the queries that are consuming the most resources or taking the most time. These are your candidate queries for optimization.
The Performance Schema
MySQL’s Performance Schema is a powerful feature for monitoring MySQL Server execution at a low level. It provides several tables that can help identify slow or resource-intensive queries.
-- Identify the slowest queries
SELECT * FROM performance_schema.events_statements_summary_by_digest
ORDER BY SUM_TIMER_WAIT DESC
LIMIT 10;
-- Identify the most frequent queries
SELECT * FROM performance_schema.events_statements_summary_by_digest
ORDER BY COUNT_STAR DESC
LIMIT 10;
This way, you can find out which queries may require optimization based on their time of execution or their frequency. Once identified, these candidate queries can be further examined for tuning options, such as improving indexing, re-writing to be more efficient, or even denormalizing some data structures.
The Statement Event Tables
In MySQL, the Performance Schema provides a rich set of tables for monitoring various statement events. These tables are invaluable for performance tuning and debugging. Here’s a breakdown:
events_statements_current
This table shows current statement events for active threads.
SELECT * FROM performance_schema.events_statements_current;
events_statements_history
This table shows the most recent statement events for each thread, up to a fixed number of rows.
SELECT * FROM performance_schema.events_statements_history;
events_statements_history_long
This table shows the most recent statement events globally, up to a fixed number of rows.
SELECT * FROM performance_schema.events_statements_history_long;
events_statements_summary_by_digest
This table aggregates statement events by their SQL digest. Useful for identifying slow queries.
SELECT * FROM performance_schema.events_statements_summary_by_digest
ORDER BY SUM_TIMER_WAIT DESC
LIMIT 10;
events_statements_summary_by_account_by_event_name
Aggregates statement events by account and event name.
SELECT * FROM performance_schema.events_statements_summary_by_account_by_event_name;
events_statements_summary_by_host_by_event_name
Aggregates statement events by host and event name.
SELECT * FROM performance_schema.events_statements_summary_by_host_by_event_name;
events_statements_summary_by_program
Aggregates statement events by the program issuing the statement.
SELECT * FROM performance_schema.events_statements_summary_by_program;
events_statements_summary_by_thread_by_event_name
Aggregates statement events by thread and event name.
SELECT * FROM performance_schema.events_statements_summary_by_thread_by_event_name;
events_statements_summary_by_user_by_event_name
Aggregates statement events by user and event name.
SELECT * FROM performance_schema.events_statements_summary_by_user_by_event_name;
events_statements_summary_global_by_event_name
Aggregates statement events globally by event name.
SELECT * FROM performance_schema.events_statements_summary_global_by_event_name;
events_statements_histogram_by_digest
This table shows histograms of statement events, grouped by SQL digest.
SELECT * FROM performance_schema.events_statements_histogram_by_digest;
events_statements_histogram_global
This table shows global histograms of statement events.
SELECT * FROM performance_schema.events_statements_histogram_global;
threads
Provides information about threads, which can be useful for correlating with statement events.
SELECT * FROM performance_schema.threads;
Prepared Statements Summary
MySQL allows the use of prepared statements, which can improve performance by reducing parsing overhead for similar queries. Performance Schema doesn’t provide a specific table for prepared statements, but their statistics are included in the general statement tables like events_statements_summary_by_digest.
SELECT * FROM performance_schema.events_statements_summary_by_digest
WHERE DIGEST_TEXT LIKE 'SELECT%FROM%WHERE%';
Table I/O Summaries
The Performance Schema also provides tables for monitoring table I/O, which can be critical for performance tuning.
table_io_waits_summary_by_table
This table summarizes the table I/O wait events grouped by table.
SELECT * FROM performance_schema.table_io_waits_summary_by_table
WHERE OBJECT_SCHEMA='your_database' AND OBJECT_NAME='your_table';
table_io_waits_summary_by_index_usage
This table summarizes the table I/O wait events, broken down by which indexes are used.
SELECT * FROM performance_schema.table_io_waits_summary_by_index_usage
WHERE OBJECT_SCHEMA='your_database' AND OBJECT_NAME='your_table';
By querying these tables, you can gain insights into which tables and indexes are most often involved in I/O waits, which is useful for identifying bottlenecks and potential areas for optimization.
File I/O
File I/O can be a significant aspect of database performance. Monitoring file operations can help identify bottlenecks and areas for improvement. MySQL’s Performance Schema provides several tables for this purpose.
events_waits_summary_global_by_event_name
This table provides aggregated statistics for wait events, including file I/O, grouped by event name.
SELECT * FROM performance_schema.events_waits_summary_global_by_event_name
WHERE EVENT_NAME LIKE 'wait/io/file/%';
file_summary_by_event_name
This table summarizes file I/O events by the event name, providing insights into the types of file operations that are consuming resources.
SELECT * FROM performance_schema.file_summary_by_event_name;
file_summary_by_instance
This table summarizes file I/O events by file instance. It can help you identify which specific files are being accessed most frequently or are causing performance issues.
SELECT * FROM performance_schema.file_summary_by_instance;
By examining these tables, you can gain valuable insights into file operations, helping you identify performance bottlenecks or other issues related to file I/O.
The Error Summary Tables
Error monitoring is an integral part of database management. Being able to quickly identify, quantify, and categorize errors can aid in both troubleshooting and optimizing your MySQL database. Here’s an overview of the Performance Schema tables designed to help with this:
events_errors_summary_by_account_by_error
This table aggregates error events by account and by error code, which helps in identifying error patterns for specific accounts.
SELECT * FROM performance_schema.events_errors_summary_by_account_by_error;
events_errors_summary_by_host_by_error
This table aggregates error events by host and error code, useful for isolating errors related to specific server hosts.
SELECT * FROM performance_schema.events_errors_summary_by_host_by_error;
events_errors_summary_by_thread_by_error
This table aggregates error events by thread and error code. You can use this table to identify errors specific to certain threads.
SELECT * FROM performance_schema.events_errors_summary_by_thread_by_error;
events_errors_summary_by_user_by_error
This table aggregates error events by user and error code. This can be particularly useful for identifying issues related to specific user activities.
SELECT * FROM performance_schema.events_errors_summary_by_user_by_error;
events_errors_summary_global_by_error
This table provides a global summary of error events, grouped by error code.
SELECT * FROM performance_schema.events_errors_summary_global_by_error;
By analyzing these tables, you can identify the types of errors that are occurring, the users or hosts they are associated with, and other contextual information that can help you in troubleshooting and performance optimization.
The sys Schema
The sys schema is a set of objects that help database administrators to better understand the performance characteristics and internals of MySQL. It provides a higher-level, more accessible view into Performance Schema, Information Schema, and other system-related information.
Statement Views
Statement views in the sys schema provide aggregated and simplified views of statement activity, helping to identify problematic queries more easily.
-- Get the top 10 slow queries
SELECT * FROM sys.statements_with_runtimes_in_95th_percentile;
-- Get statements that are causing full table scans
SELECT * FROM sys.statements_with_full_table_scans;
Table I/O Views
Table I/O views offer insights into table-level statistics, which can be critical for performance optimization.
schema_index_statistics
This view provides index usage statistics by schema.
SELECT * FROM sys.schema_index_statistics WHERE table_schema = 'your_database';
schema_table_statistics
This view gives detailed table statistics including the number of rows read or modified.
SELECT * FROM sys.schema_table_statistics WHERE table_schema = 'your_database';
schema_table_statistics_with_buffer
This view extends schema_table_statistics with buffer statistics like the number of pages in buffer pool related to the table.
SELECT * FROM sys.schema_table_statistics_with_buffer WHERE table_schema = 'your_database';
schema_tables_with_full_table_scans
This view identifies tables that are subject to full table scans, which are often performance bottlenecks.
SELECT * FROM sys.schema_tables_with_full_table_scans WHERE object_schema = 'your_database';
schema_unused_indexes
This view shows indexes that have not been used, which can be candidates for removal to save space and improve write performance.
SELECT * FROM sys.schema_unused_indexes;
By using these views and tables in the sys schema, administrators can more effectively monitor and optimize MySQL performance.
File I/O Views
These views are part of the sys schema and aim to provide aggregated information about file input/output operations. They allow administrators to focus on file-level metrics to understand better and optimize performance.
host_summary_by_file_io
This view aggregates file I/O statistics by host, enabling you to identify which hosts are most active or could be bottlenecks.
SELECT * FROM sys.host_summary_by_file_io;
host_summary_by_file_io_type
This view breaks down the file I/O by type of operation (read, write, etc.) for each host.
SELECT * FROM sys.host_summary_by_file_io_type;
io_by_thread_by_latency
This view provides I/O statistics grouped by thread and sorted by latency, useful for identifying slow operations at the thread level.
SELECT * FROM sys.io_by_thread_by_latency;
io_global_by_file_by_bytes
This global view shows file I/O operations, grouped by the file and the number of bytes read/written, which helps identify the most active files.
SELECT * FROM sys.io_global_by_file_by_bytes;
io_global_by_file_by_latency
This is similar to the previous view but focuses on latency, showing you which files are experiencing delays during read or write operations.
SELECT * FROM sys.io_global_by_file_by_latency;
io_global_by_wait_by_bytes
This view provides global I/O statistics based on bytes, but focuses on wait times, helping to pinpoint where bottlenecks might be occurring.
SELECT * FROM sys.io_global_by_wait_by_bytes;
io_global_by_wait_by_latency
Like the previous view, this one focuses on wait times but is sorted by latency, highlighting where the slowest operations are happening.
SELECT * FROM sys.io_global_by_wait_by_latency;
user_summary_by_file_io
This view aggregates file I/O operations by user, providing insights into user-specific read/write activities.
SELECT * FROM sys.user_summary_by_file_io;
user_summary_by_file_io_type
This view breaks down file I/O by type of operation for each user, which can be useful for identifying specific behaviors that could be optimized.
SELECT * FROM sys.user_summary_by_file_io_type;
By leveraging these views, database administrators can achieve a more granular understanding of file I/O behaviors and performance bottlenecks, thus allowing for more targeted optimizations.
Statement Performance Analyzer
The Statement Performance Analyzer features in the sys schema offer valuable tools for examining query performance and identifying potential optimizations.
events_statements_summary_by_digest
This table aggregates statement statistics and groups them by their normalized SQL digest, which helps you identify which SQL statements are being executed most frequently and consume the most resources.
SELECT * FROM sys.events_statements_summary_by_digest
ORDER BY SUM_TIMER_WAIT DESC
LIMIT 10;
statement_performance_analyzer() procedure
The statement_performance_analyzer() procedure is a more advanced tool that offers various options for analyzing statement performance. It uses the events_statements_summary_by_digest table as its data source.
debug
The debug option can be used for debugging the procedure itself.
CALL sys.statement_performance_analyzer('debug');
statement_performance_analyzer.limit
The limit option allows you to specify how many rows to return, which is useful when dealing with large datasets.
SET @limit = 10;
CALL sys.statement_performance_analyzer('limit', @limit);
statement_performance_analyzer.view
The view option allows you to select the specific type of information you want to see. For example, you might want to view statistics sorted by the highest average latency.
SET @view_name = 'sys.x$statement_analysis';
CALL sys.statement_performance_analyzer('view', @view_name);
By using these tables and procedures, database administrators can fine-tune SQL queries and identify possible performance issues that need attention. This can lead to significant improvements in database performance and responsiveness.
MySQL Workbench
MySQL Workbench is an integrated development environment (IDE) for MySQL databases. It provides a range of tools for database design, querying, and administration. One of the significant advantages of using MySQL Workbench is its built-in reporting and analytics capabilities.
Performance Reports
Performance Reports in MySQL Workbench are graphical dashboards that provide a snapshot of various metrics related to your MySQL server’s performance. These metrics can include CPU usage, memory utilization, network activity, and more.
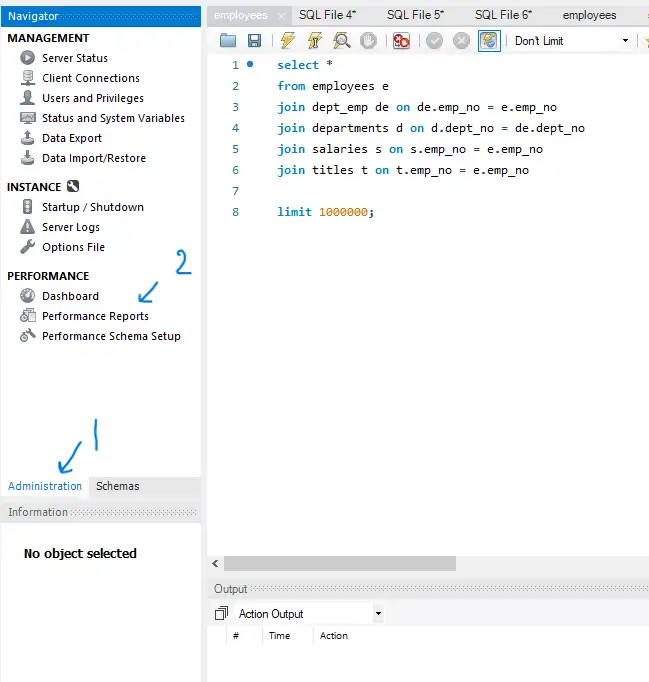
Statements Analysis
Within Performance Reports, the Statements Analysis section can help you identify slow or problematic queries. It offers a detailed view of the query execution times, the number of rows examined, and other critical metrics.
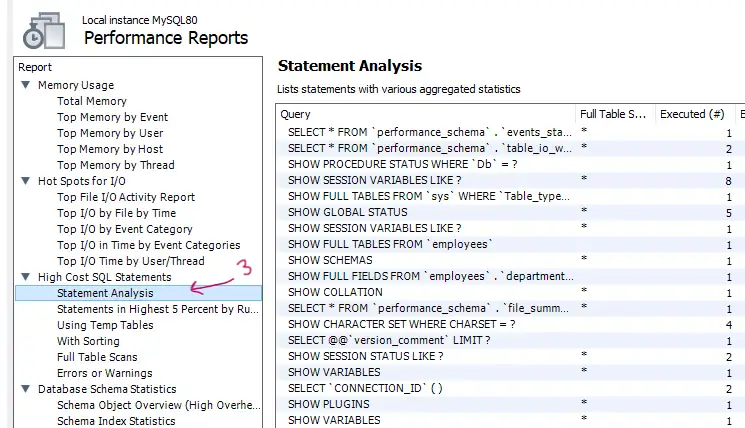
Client Connections Report
The Client Connections Report provides an overview of the current client connections to your MySQL server. This includes information such as the client’s IP address, the user account they are using, the queries they are executing, and more.
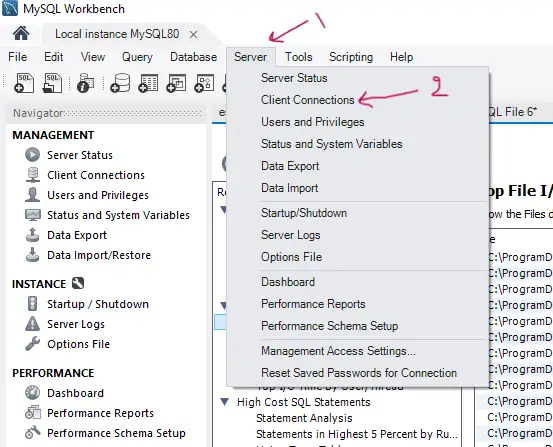
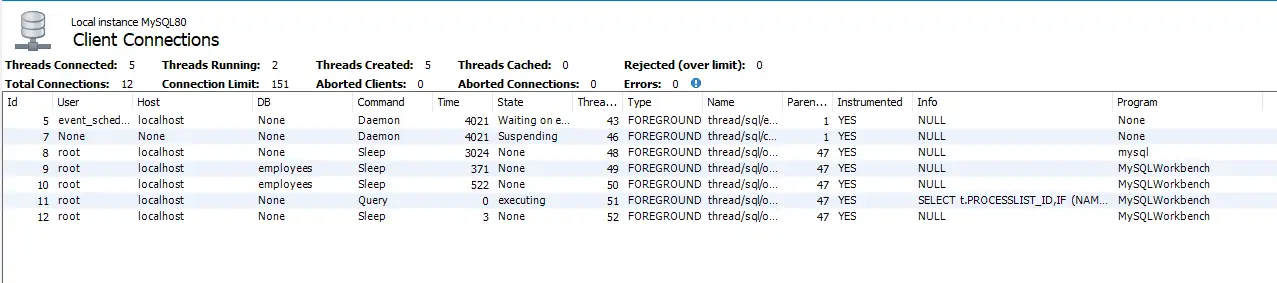
Analyzing Queries
Understanding the execution plan of SQL queries is fundamental for query optimization. The EXPLAIN command in MySQL allows you to do just that.
EXPLAIN Usage
The EXPLAIN keyword in MySQL is used to obtain a query execution plan, which describes how MySQL intends to execute the query. This plan can be useful to identify inefficient operations that may slow down query execution.
EXPLAIN SELECT * FROM users WHERE user_id = 1;
Usage for Explicit Queries
While using EXPLAIN, you can specify the format of the output using the FORMAT option to make the information more understandable or tailored to specific debugging needs.
FORMAT=TRADITIONAL
The traditional format provides a tabular representation of the query plan, showing columns like id, select_type, table, type, possible_keys, key, key_len, ref, rows, and Extra.
EXPLAIN FORMAT=TRADITIONAL SELECT * FROM users WHERE user_id = 1;
FORMAT=JSON
The JSON format provides a machine-readable output that includes detailed information about partitions, subqueries, and other aspects of query execution.
EXPLAIN FORMAT=JSON SELECT * FROM users WHERE user_id = 1;
FORMAT=TREE
The TREE format, available in certain versions of MySQL, provides a visual representation of the query plan, highlighting the hierarchical nature of query execution.
-- Note: The TREE format may not be available in all MySQL versions
EXPLAIN FORMAT=TREE SELECT * FROM users WHERE user_id = 1;
Each of these formats has its own use-cases and advantages. Depending on your specific requirements and the complexity of the query, you may find one format more useful than the others for query optimization.
EXPLAIN ANALYZE
While EXPLAIN provides an estimated execution plan, EXPLAIN ANALYZE goes a step further by actually executing the query and reporting the actual time taken for each step. This can be especially helpful for fine-tuning query performance.
Usage for Connections
EXPLAIN ANALYZE can be used within an active MySQL client connection to obtain actual performance metrics for a query. Be cautious when using this on production databases as it does actually execute the query.
EXPLAIN ANALYZE SELECT * FROM users WHERE user_id = 1;
EXPLAIN Formats
Like EXPLAIN, EXPLAIN ANALYZE supports various output formats for easier analysis.
Traditional Format
The traditional format shows the actual time taken at each step of the query execution, along with the regular EXPLAIN output.
EXPLAIN ANALYZE FORMAT=TRADITIONAL SELECT * FROM users WHERE user_id = 1;
JSON Format
JSON format adds an "executionTime" field in the JSON output to display the actual time taken.
EXPLAIN ANALYZE FORMAT=JSON SELECT * FROM users WHERE user_id = 1;
Tree Format
The Tree format provides a visual and hierarchical representation of the execution plan along with the actual time taken.
-- Note: The TREE format may not be available in all MySQL versions
EXPLAIN ANALYZE FORMAT=TREE SELECT * FROM users WHERE user_id = 1;
Visual Explain
Some tools, like MySQL Workbench, offer a Visual Explain feature that graphically represents the query execution plan. This visual aid can make it easier to understand the various stages of query execution and how long each took.
To get Visual Explain press this button
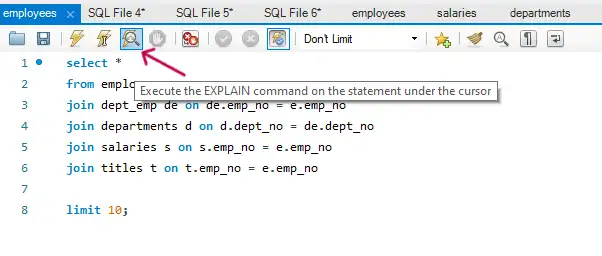
then after that a Visual plan window will open
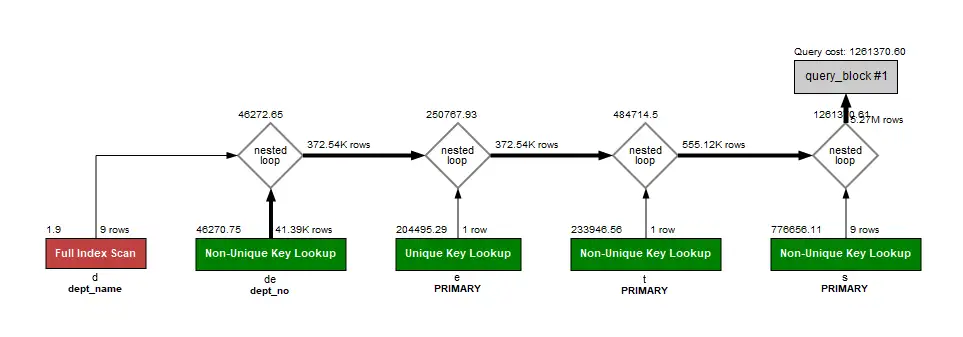
Below is collection taken from book grouping all possible outputs
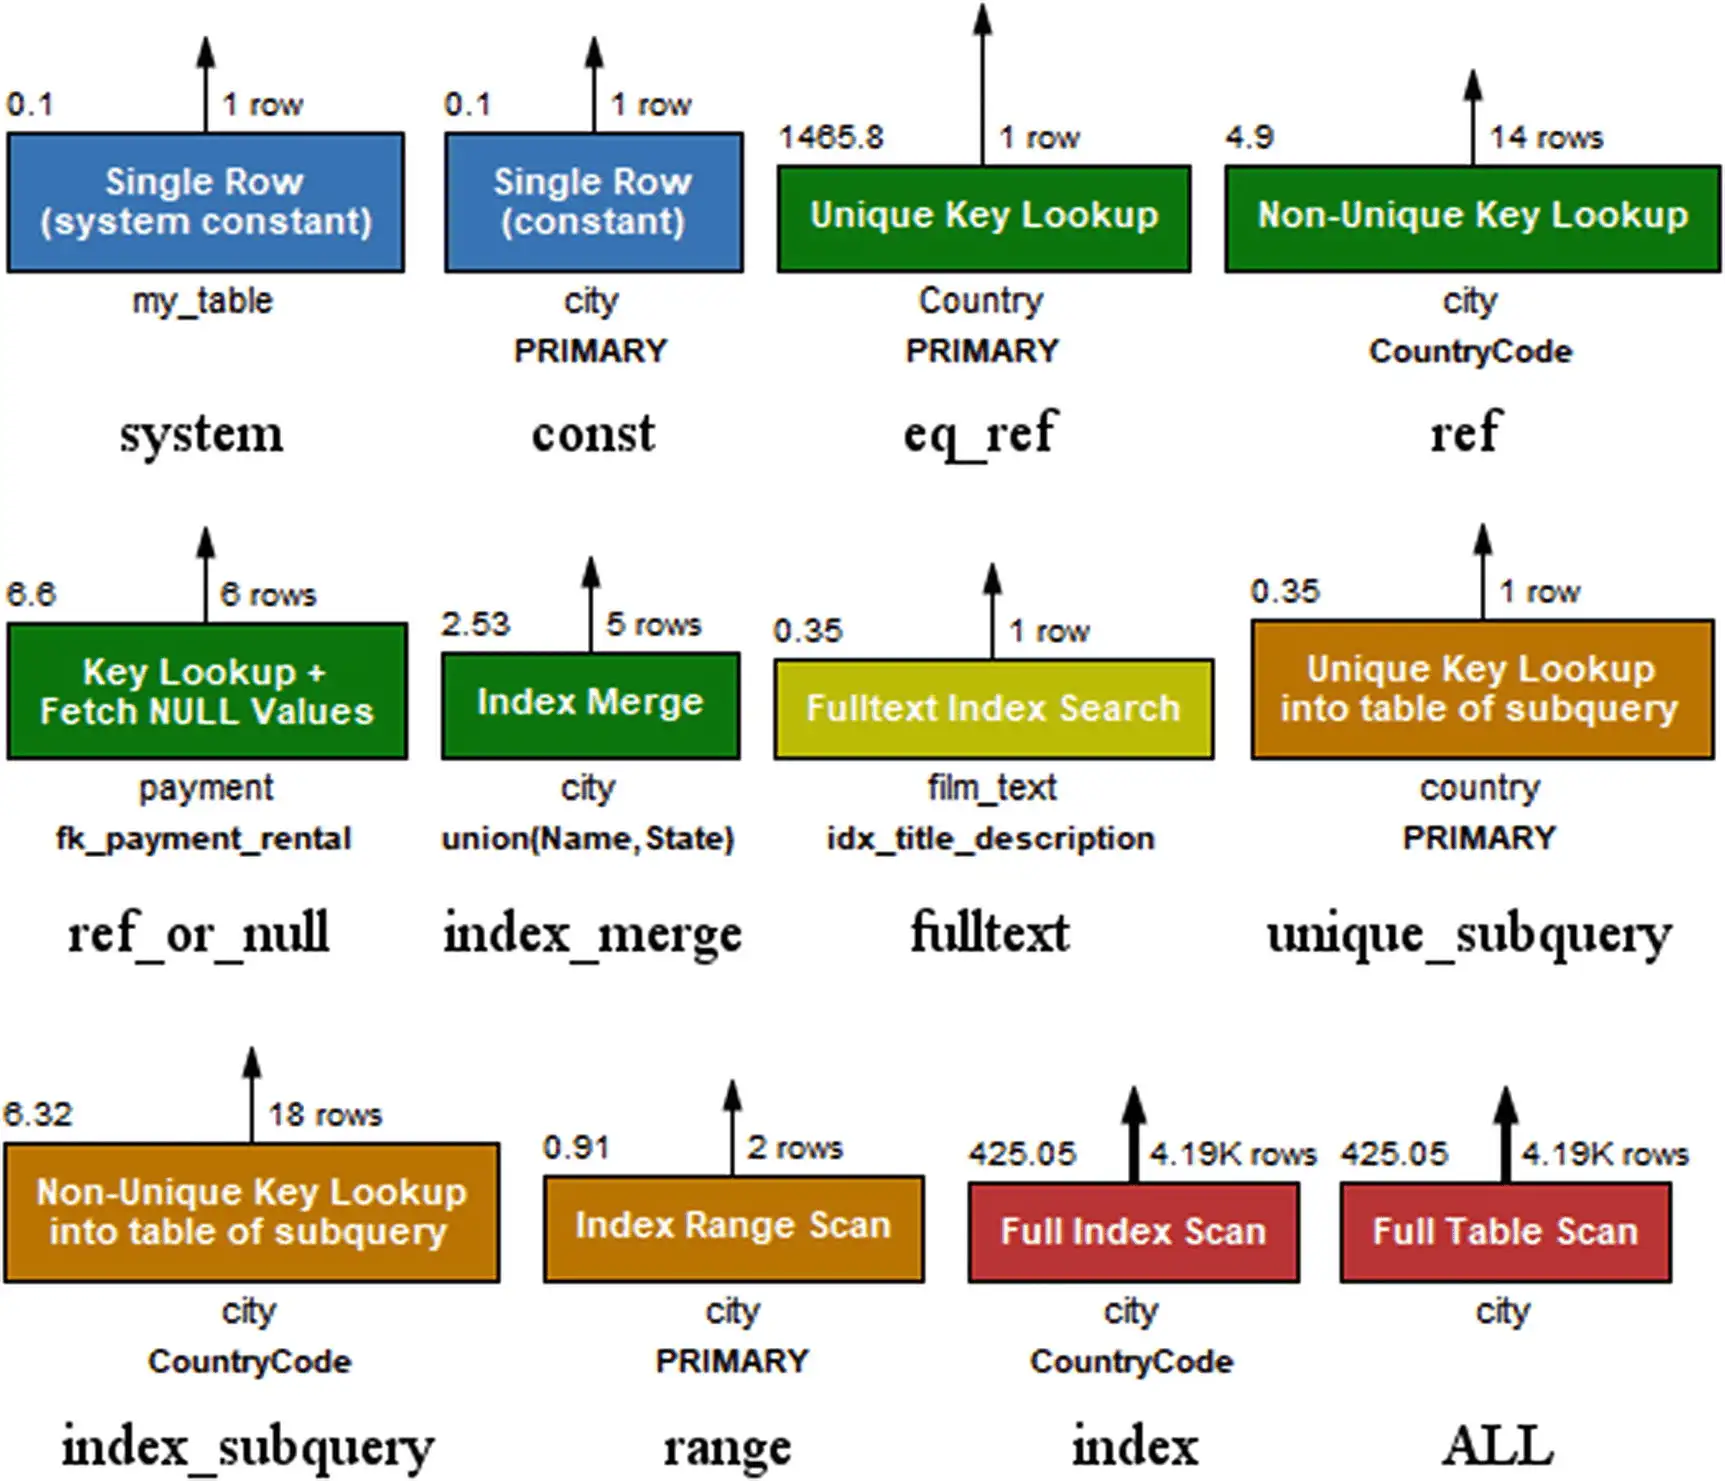
By understanding and utilizing EXPLAIN ANALYZE, you can acquire more accurate performance data for your queries, which can be instrumental in optimization efforts.
Cost of each color
- Blue: is the cheapest
- Green, yellow, and orange: represent low to medium costs
- Red: the most expensive access types and operations are red symbolizing a high to very high cost.
EXPLAIN Output
EXPLAIN Fields
The EXPLAIN statement’s output has several fields that help understand how a SQL query is executed. Here, we will go through some of the crucial fields and types.
Select Types
The select_type field specifies the type of the SELECT query, such as SIMPLE, SUBQUERY, or DERIVED.
Access Types
Access types describe the strategy MySQL uses to access the data in the table. Below are various access types with their explanations and examples:
System
The system access type is used with tables that have exactly one row
-- Example: In cases like dual table or single-row system tables
SELECT * FROM (SELECT 1) my_table
const
The const type means that the query will read only one row based on a constant. This is the fastest type of access.
-- Example: A primary key or unique index lookup
EXPLAIN SELECT * FROM users WHERE id = 1;
eq_ref
Here, MySQL can pick a single row using a unique or primary key in a join operation.
-- Example: A join using a unique key
EXPLAIN SELECT * FROM orders JOIN users ON users.id = orders.user_id WHERE orders.id = 1;
ref
MySQL will perform an index scan but may return more than one row. The index need not be unique.
-- Example: A simple index scan
EXPLAIN SELECT * FROM users WHERE last_name = 'Smith';
ref_or_null
MySQL will scan an index looking for rows that match a reference or are NULL.
-- Example: Query using IS NULL condition with a key
EXPLAIN SELECT * FROM users WHERE key_column = 'value' OR key_column IS NULL;
index_merge
This type indicates that MySQL will merge several index scans to retrieve rows.
-- Example: Using index_merge optimization
EXPLAIN SELECT * FROM table WHERE key1 = 10 OR key2 = 20;
fulltext
This access type is used for full-text index searches.
-- Example: A full-text search
EXPLAIN SELECT * FROM articles WHERE MATCH(title, body) AGAINST('mysql');
unique_subquery
This type is used when a subquery is executed using a unique index or primary key to fetch a single row.
-- Example: IN subquery that can utilize unique indexes
EXPLAIN SELECT * FROM table1 WHERE id IN (SELECT unique_key FROM table2 WHERE condition);
Extra Information in EXPLAIN
The Extra field in EXPLAIN output provides additional information on how MySQL will execute the query. Understanding these details can be crucial for query optimization.
*************************** 1. row ***************************
  id: 1
  select_type: SIMPLE
  ....
  Extra: Using index
Using index
Indicates that MySQL will use a covering index to avoid accessing the table.
-- Example: Covering index
EXPLAIN SELECT username FROM users WHERE id = 1;
Using index condition
MySQL will use the indexed columns to evaluate the WHERE condition.
-- Example: Index condition pushdown
EXPLAIN SELECT * FROM users WHERE id = 1 AND username = 'john';
Using where
Indicates that a WHERE clause is used to filter rows.
-- Example: Using a WHERE clause
EXPLAIN SELECT * FROM users WHERE age > 25;
Using index for group-by
The query is optimized by reading an index for GROUP BY or ORDER BY.
-- Example: Index used for GROUP BY
EXPLAIN SELECT age, COUNT(*) FROM users GROUP BY age;
Using join buffer (Block Nested Loop)
The Block Nested Loop algorithm is used for joining tables.
-- Example: Using Block Nested Loop for joins
EXPLAIN SELECT * FROM users JOIN orders ON users.id = orders.user_id;
Using join buffer (Batched Key Access)
Batched Key Access algorithm is used for joining tables.
-- Example: Batched Key Access for joins
EXPLAIN SELECT * FROM users u JOIN orders o ON u.id = o.user_id;
Using MRR
Indicates that MySQL will use Multi-Range Read optimization.
-- Example: Using MRR
EXPLAIN SELECT * FROM orders WHERE user_id IN (1, 2, 3);
Using filesort
MySQL will perform an extra pass to sort the records.
-- Example: Using filesort for sorting
EXPLAIN SELECT * FROM users ORDER BY age;
Using temporary
MySQL will use a temporary table to hold intermediate results.
-- Example: Using a temporary table
EXPLAIN SELECT age, COUNT(*) FROM users GROUP BY age ORDER BY COUNT(*) DESC;
sort_union(…), Using union(…), Using intersect(…)
Indicates various set operations like UNION, INTERSECT.
-- Example: Using UNION
EXPLAIN SELECT id FROM t1 WHERE a=10 UNION SELECT id FROM t2 WHERE a=20;
Recursive
Used in recursive queries.
-- Example: Recursive CTEs
EXPLAIN WITH RECURSIVE cte AS (SELECT 1) SELECT * FROM cte;
Range checked for each record (index map: 0x1)
MySQL will decide which index to use while scanning each row during a join operation.
-- Example: Range checked for each record
EXPLAIN SELECT * FROM t1, t2 WHERE t1.a=t2.a AND t2.b=10;
Impossible WHERE
The WHERE clause always evaluates to false.
-- Example: Impossible WHERE clause
EXPLAIN SELECT * FROM users WHERE 1=0;
Impossible WHERE noticed after reading const tables
MySQL determined that the query can’t possibly return a row by just looking at the constant tables.
-- Example: Impossible WHERE after reading const tables
EXPLAIN SELECT * FROM users WHERE id=1 AND 1=0;
Impossible HAVING
The HAVING clause filters out all rows.
-- Example: Impossible HAVING clause
EXPLAIN SELECT COUNT(*) FROM users HAVING COUNT(*) < 0;
Using index for skip scan
The index is used but not in a regular manner, jumping over rows as determined by the query conditions.
-- Example: Skip scan
EXPLAIN SELECT * FROM users WHERE key1 = 10 AND key2 = 5;
Select tables optimized away
No table is required to execute the query.
-- Example: Table optimized away
EXPLAIN SELECT MAX(age) FROM users WHERE age IS NOT NULL;
No tables used
The query doesn’t require any tables, probably because it deals with constant values.
-- Example: No tables used
EXPLAIN SELECT 1 + 1;
no matching row in const table
The const table does not have any matching rows, causing the query to return no rows.
-- Example: No matching rows in a const table
EXPLAIN SELECT * FROM users WHERE id = 'nonexistent';
Optimizer Trace
MySQL’s Optimizer Trace feature provides detailed insight into how the optimizer chooses a particular query execution plan. Below are several key aspects of the Optimizer Trace.
QUERY
This is the section of the Optimizer Trace that shows the query being analyzed. It’s essential for understanding which query’s execution plan you are examining.
TRACE
The TRACE information provides the most extensive details about the optimization process. It contains various metrics, choices made, alternative plans considered, and much more.
SET optimizer_trace="enabled=on";
After running your query, you can get the trace info with:
SELECT * FROM information_schema.optimizer_trace;
This gives a JSON-formatted explanation of how MySQL optimized the query.
MISSING_BYTES_BEYOND_MAX_MEM_SIZE
If the Optimizer Trace output gets too large and exceeds the maximum allowed size (max_mem_size), this field will indicate the number of bytes that couldn’t be stored.
SET optimizer_trace_max_mem_size = value_in_bytes;
INSUFFICIENT_PRIVILEGES
This section will notify you if you lack the necessary permissions to view the Optimizer Trace.
-- Grant SUPER privilege to a user
GRANT SUPER ON *.* TO 'username'@'hostname';
Understanding these elements of the Optimizer Trace can be instrumental in identifying why the MySQL query optimizer chose a particular query plan and how you might be able to optimize your queries further.
Performance Schema Events Analysis
Performance Schema in MySQL allows for fine-grained monitoring, with numerous tables that capture different types of server events. One area of interest could be understanding the performance of stored procedures.
Examining a Stored Procedure
When debugging or optimizing stored procedures, the Performance Schema offers several tables and techniques.
events_statements_history table
This table contains a history of SQL statements executed. It’s useful for seeing the sequence of queries that were run within a stored procedure.
SELECT * FROM performance_schema.events_statements_history WHERE THREAD_ID = your_thread_id;
performance_schema_events_statements_history_size
This system variable sets the number of rows that can be stored in the events_statements_history table.
SET performance_schema_events_statements_history_size = your_desired_value;
events_statements_history_long
Similar to events_statements_history, but this table has a much larger size limit, providing a longer history.
SELECT * FROM performance_schema.events_statements_history_long WHERE THREAD_ID = your_thread_id;
sys.ps_trace_thread()
This stored procedure can be used to trace the activity of a particular thread, making it easier to debug stored procedures. It aggregates data from multiple Performance Schema tables.
CALL sys.ps_trace_thread(your_thread_id);
By using these Performance Schema tables and utilities, you can gain a more comprehensive understanding of how your stored procedures are being executed, where they might be inefficient, or if there are any issues that need attention.
Transactions
Transactions are a core feature in MySQL, responsible for maintaining the integrity of your database by ensuring that sets of related operations either complete successfully or leave the database in a consistent state if something goes wrong.
Impact of Transactions
Locks
When you start a transaction and execute a SELECT ... FOR UPDATE query, MySQL places exclusive locks on the affected rows. This prevents other transactions from modifying the locked rows until your transaction is committed or rolled back.
START TRANSACTION;
SELECT * FROM table_name FOR UPDATE;
-- Other operations
COMMIT;
The above SQL snippet initiates a transaction, locks rows from table_name for update, performs other operations, and finally commits the transaction to release the locks.
Undo Logs
Undo logs are used to keep the old version of a row so that it can be restored in case of a transaction rollback. The ROLLBACK command can be used to undo all the changes made during the transaction.
START TRANSACTION;
DELETE FROM table_name WHERE condition;
-- Other operations
ROLLBACK;
The SQL snippet initiates a transaction, deletes rows from table_name based on a condition, performs other operations, and then rolls back the entire transaction, thereby undoing the delete operation.
innodb_purge_batch_size
The innodb_purge_batch_size setting controls the number of undo logs that MySQL will purge in each batch operation.
SET GLOBAL innodb_purge_batch_size = 300;
Changing this to a larger value could speed up the purging process, but it may consume more CPU and I/O resources.
innodb_purge_threads
This setting controls the number of threads that MySQL dedicates to the task of purging undo logs.
SET GLOBAL innodb_purge_threads = 4;
Increasing the number of threads can speed up the purging process but will consume more CPU resources.
innodb_max_purge_lag
This setting can be used to throttle the rate of new transactions when the system experiences high lag in undo log purges.
SET GLOBAL innodb_max_purge_lag = 80000;
Setting a higher value will allow more lag but can delay new transactions.
innodb_max_purge_lag_delay
This setting specifies the maximum delay in milliseconds for new transactions when the system is experiencing high lag in purges.
SET GLOBAL innodb_max_purge_lag_delay = 50;
This can be useful to balance the load on your MySQL server when there’s high lag in undo log purges.
INNODB_TRX
The INNODB_TRX table in the information schema provides details about currently running InnoDB transactions. You can query this table to get information about transactions, such as their state, the number of locks they hold, and more.
SELECT * FROM INFORMATION_SCHEMA.INNODB_TRX;
This query will return a dataset that includes columns like trx_id, trx_state, trx_started, among others, which provide details about each active transaction.
sys.innodb_lock_waits
The sys.innodb_lock_waits view in MySQL helps you identify transactions that are waiting for locks. This information can be useful for detecting and resolving deadlocks or performance issues related to locking.
SELECT * FROM sys.innodb_lock_waits;
This query provides information on which transactions are waiting for locks, the objects they are waiting on, and other related details.
InnoDB Monitor
To fetch real-time information about the InnoDB storage engine, you can use the SHOW ENGINE INNODB STATUS command. This provides detailed data about various aspects like locks, transactions, buffer pool status, and more.
SHOW ENGINE INNODB STATUS;
The output will include various sections like “SEMAPHORES,” “TRANSACTIONS,” “FILE I/O,” etc., each offering detailed information on those aspects.
INNODB_METRICS and sys.metrics
You can use the INFORMATION_SCHEMA.INNODB_METRICS and sys.metrics tables to gather detailed performance and usage statistics for the InnoDB storage engine.
SELECT * FROM INFORMATION_SCHEMA.INNODB_METRICS;
SELECT * FROM sys.metrics;
These queries will return a list of metrics with their current values, making it easier to diagnose performance issues or understand the behavior of your MySQL server.
Performance Schema Transactions
The Performance Schema offers several tables to monitor transactions in MySQL. You can use these tables to drill down into the specific events and statements associated with each transaction.
SELECT * FROM performance_schema.events_transactions_current;
This query will list the current transaction events, which can be useful for real-time debugging and performance tuning.
Transaction Summary Tables
You can use various summary tables in the Performance Schema to get an aggregated view of transactions. These can be useful for identifying patterns, performance bottlenecks, or issues like frequent rollbacks or lock waits.
SELECT * FROM performance_schema.events_transactions_summary_global_by_event_name;
This query will provide a global summary of transaction events, grouped by event name. It helps in identifying which types of transactions are most common and how they are affecting your database’s performance.
Recommendations
Best Practices
SQL Statement Optimization
LIMIT Clauses: Always use
LIMITwhenever possible, especially in combination withORDER BY.SELECT * FROM table ORDER BY column LIMIT 10;Recommended Formula:
LIMIT=Expected rows+Buffer(e.g., 10 + 2)Use of Indexes: Indexes should be used judiciously. For a table with N rows, aim to have log2(N) indexes or fewer.
CREATE INDEX idx_column ON table (column);EXPLAIN Plans: Always use
EXPLAINto understand your query’s execution plan.EXPLAIN SELECT * FROM table;
InnoDB Overview
InnoDB is an optimal choice for OLTP (Online Transaction Processing) systems due to its support for high concurrency and consistent performance.
The InnoDB Buffer Pool
The InnoDB Buffer Pool is crucial for MySQL performance optimization. It serves as a cache for data and indexes.
Buffer Pool Size
innodb_buffer_pool_size: This is the most crucial InnoDB performance optimization setting.SET GLOBAL innodb_buffer_pool_size = 8G; -- or 80% of available physical RAMRecommended Formula: 80% of your server’s physical RAM.
Buffer Pool Instances
innodb_buffer_pool_instances: Each instance manages a portion of the buffer pool, making memory operations more efficient.SET GLOBAL innodb_buffer_pool_instances = 8;Recommended Formula:
Number of instances=innodb_buffer_pool_size / 1GB
Dumping the Buffer Pool
innodb_buffer_pool_dump_now: Dumping the buffer pool can be a life-saver for quick MySQL restarts.SET GLOBAL innodb_buffer_pool_dump_now = ON;
Old Blocks Sublist
innodb_old_blocks_time: This is the time in milliseconds that blocks are kept in the old block list.SET GLOBAL innodb_old_blocks_time = 1000;Recommended Formula: This setting should typically be set to the round-trip time (RTT) of your storage subsystem.
Flushing Pages
innodb_flush_method: Controls how data is written to disk.SET GLOBAL innodb_flush_method = 'O_DIRECT';Recommended Formula:
O_DIRECTfor Linux, andunbufferedfor Windows.
The Redo Log
Redo logs provide durability in InnoDB. They keep a record of all changes made to the database.
Log Buffer
innodb_log_buffer_size: Increase this size to hold more log entries in the buffer, reducing disk I/O.SET GLOBAL innodb_log_buffer_size = 16M;Recommended Formula: Twice the size of a full transaction log for your largest transaction.
Log Files
innodb_log_file_sizeandinnodb_log_files_in_group: Increase these sizes for higher write performance.SET GLOBAL innodb_log_file_size = 512M; SET GLOBAL innodb_log_files_in_group = 3;Recommended Formula: The total log file size (
innodb_log_file_size*innodb_log_files_in_group) should be 25-50% of theinnodb_buffer_pool_size.
Parallel Query Execution
MySQL 8.0+ offers parallel query execution for read-only queries, though it is limited. For full-table scans or index scans, threads can be used to scan different parts of the table in parallel.
Recommended Formula: Number of worker threads = Number of CPU cores / 2
Query Buffers
query_cache_size: This setting is deprecated as of MySQL 8.0. Use the native InnoDB buffer pool for better performance.Recommended Formula: Set it to 0, unless you’re on an older MySQL version and thoroughly understand the workload.
Internal Temporary Tables
internal_tmp_mem_storage_engine: This setting controls the storage engine for internal temporary tables.SET GLOBAL internal_tmp_mem_storage_engine = 'MEMORY';Recommended Formula: Use
MEMORYfor OLTP workloads andInnoDBfor OLAP workloads.
Improving the Queries
Performance issues can arise due to multiple factors such as bad query design, improper indexes, or inefficient query execution plans.
Change the Query Plan
Sometimes, manually hinting the optimizer about the JOIN order can improve performance. Use STRAIGHT_JOIN to force a certain join order.
SELECT STRAIGHT_JOIN a.*, b.* FROM table1 a, table2 b WHERE a.id = b.id;
Symptoms of Excessive Full Table Scans
Repeated full table scans can slow down query execution time significantly. The signs often include:
- High IO utilization
- Slow query log filled with queries without WHERE clauses or full index scans (
type: ALLin EXPLAIN output).
Wrong Query
Errors in query design, such as missing join conditions, can lead to performance issues. Always ensure that JOIN operations have ON clauses that utilize indexed columns.
-- Wrong
SELECT * FROM orders, customers;
-- Right
SELECT * FROM orders JOIN customers ON orders.customer_id = customers.id;
No Index Used
Check the EXPLAIN plan to ensure indexes are being used. If not, consider adding appropriate indexes.
EXPLAIN SELECT * FROM table WHERE column = 'value';
Not a Left Prefix of Index
MySQL can only use an index if the WHERE clause uses the leftmost prefix of the index. So, for a composite index (a,b,c):
-- This will not use the index
SELECT * FROM table WHERE b = 1 AND c = 2;
Data Types Not Matching
Always make sure the WHERE clause’s data types match the table column’s data types.
-- This can be inefficient due to datatype conversion
SELECT * FROM table WHERE string_column = 12345;
Functional Dependencies
Understanding the functional dependencies in your tables can help you write optimized queries. For instance, if a -> b, then filtering by a is as good as filtering by b.
Improving the Index Use
Add a Covering Index
Covering indexes can significantly improve query performance.
CREATE INDEX covering_index ON table(column1, column2);
Wrong Index
Sometimes MySQL picks an incorrect index due to outdated statistics. Running ANALYZE TABLE can update the statistics and help the optimizer make a better choice.
ANALYZE TABLE table_name;
Rewriting Complex Index Conditions
In case the query optimizer fails to pick a good plan for a complex query, consider manually simplifying the query.
-- Instead of
SELECT * FROM table WHERE complex_function(column) < 100;
-- Use
SELECT * FROM table WHERE column BETWEEN value1 AND value2;
Rewriting Complex Queries
Common Table Expressions
They can make your query more readable and sometimes more efficient.
WITH cte AS (SELECT * FROM table WHERE condition)
SELECT * FROM cte WHERE another_condition;
Window Functions
They are often more efficient than subqueries for computing aggregate functions over a partition.
SELECT AVG(column) OVER (PARTITION BY another_column) FROM table;
Rewrite Subquery As Join
Sometimes JOINs are more efficient than subqueries.
-- Instead of
SELECT * FROM table WHERE column = (SELECT ...);
-- Use
SELECT * FROM table JOIN (SELECT ...) sub ON table.column = sub.column;
Splitting a Query Into Parts
For large datasets, consider splitting a query into multiple smaller queries to avoid locking the table for an extended period.
Queue System: SKIP LOCKED
The SKIP LOCKED option is great for implementing a queue system where you don’t want rows that are locked by another transaction.
SELECT * FROM table WHERE condition FOR UPDATE SKIP LOCKED;
Many OR or IN Conditions
When the query has many OR or IN conditions, consider using a temporary table to store the values and then JOIN it with the main table.
-- Create a temp table and index it
CREATE TEMPORARY TABLE temp_table (id INT PRIMARY KEY);
-- Populate temp table
INSERT INTO temp_table VALUES (...);
-- Perform the JOIN
SELECT * FROM main_table JOIN temp_table ON main_table.id = temp_table.id;
By recognizing and addressing these advanced issues, you can significantly improve the performance of your MySQL queries.